Question 24
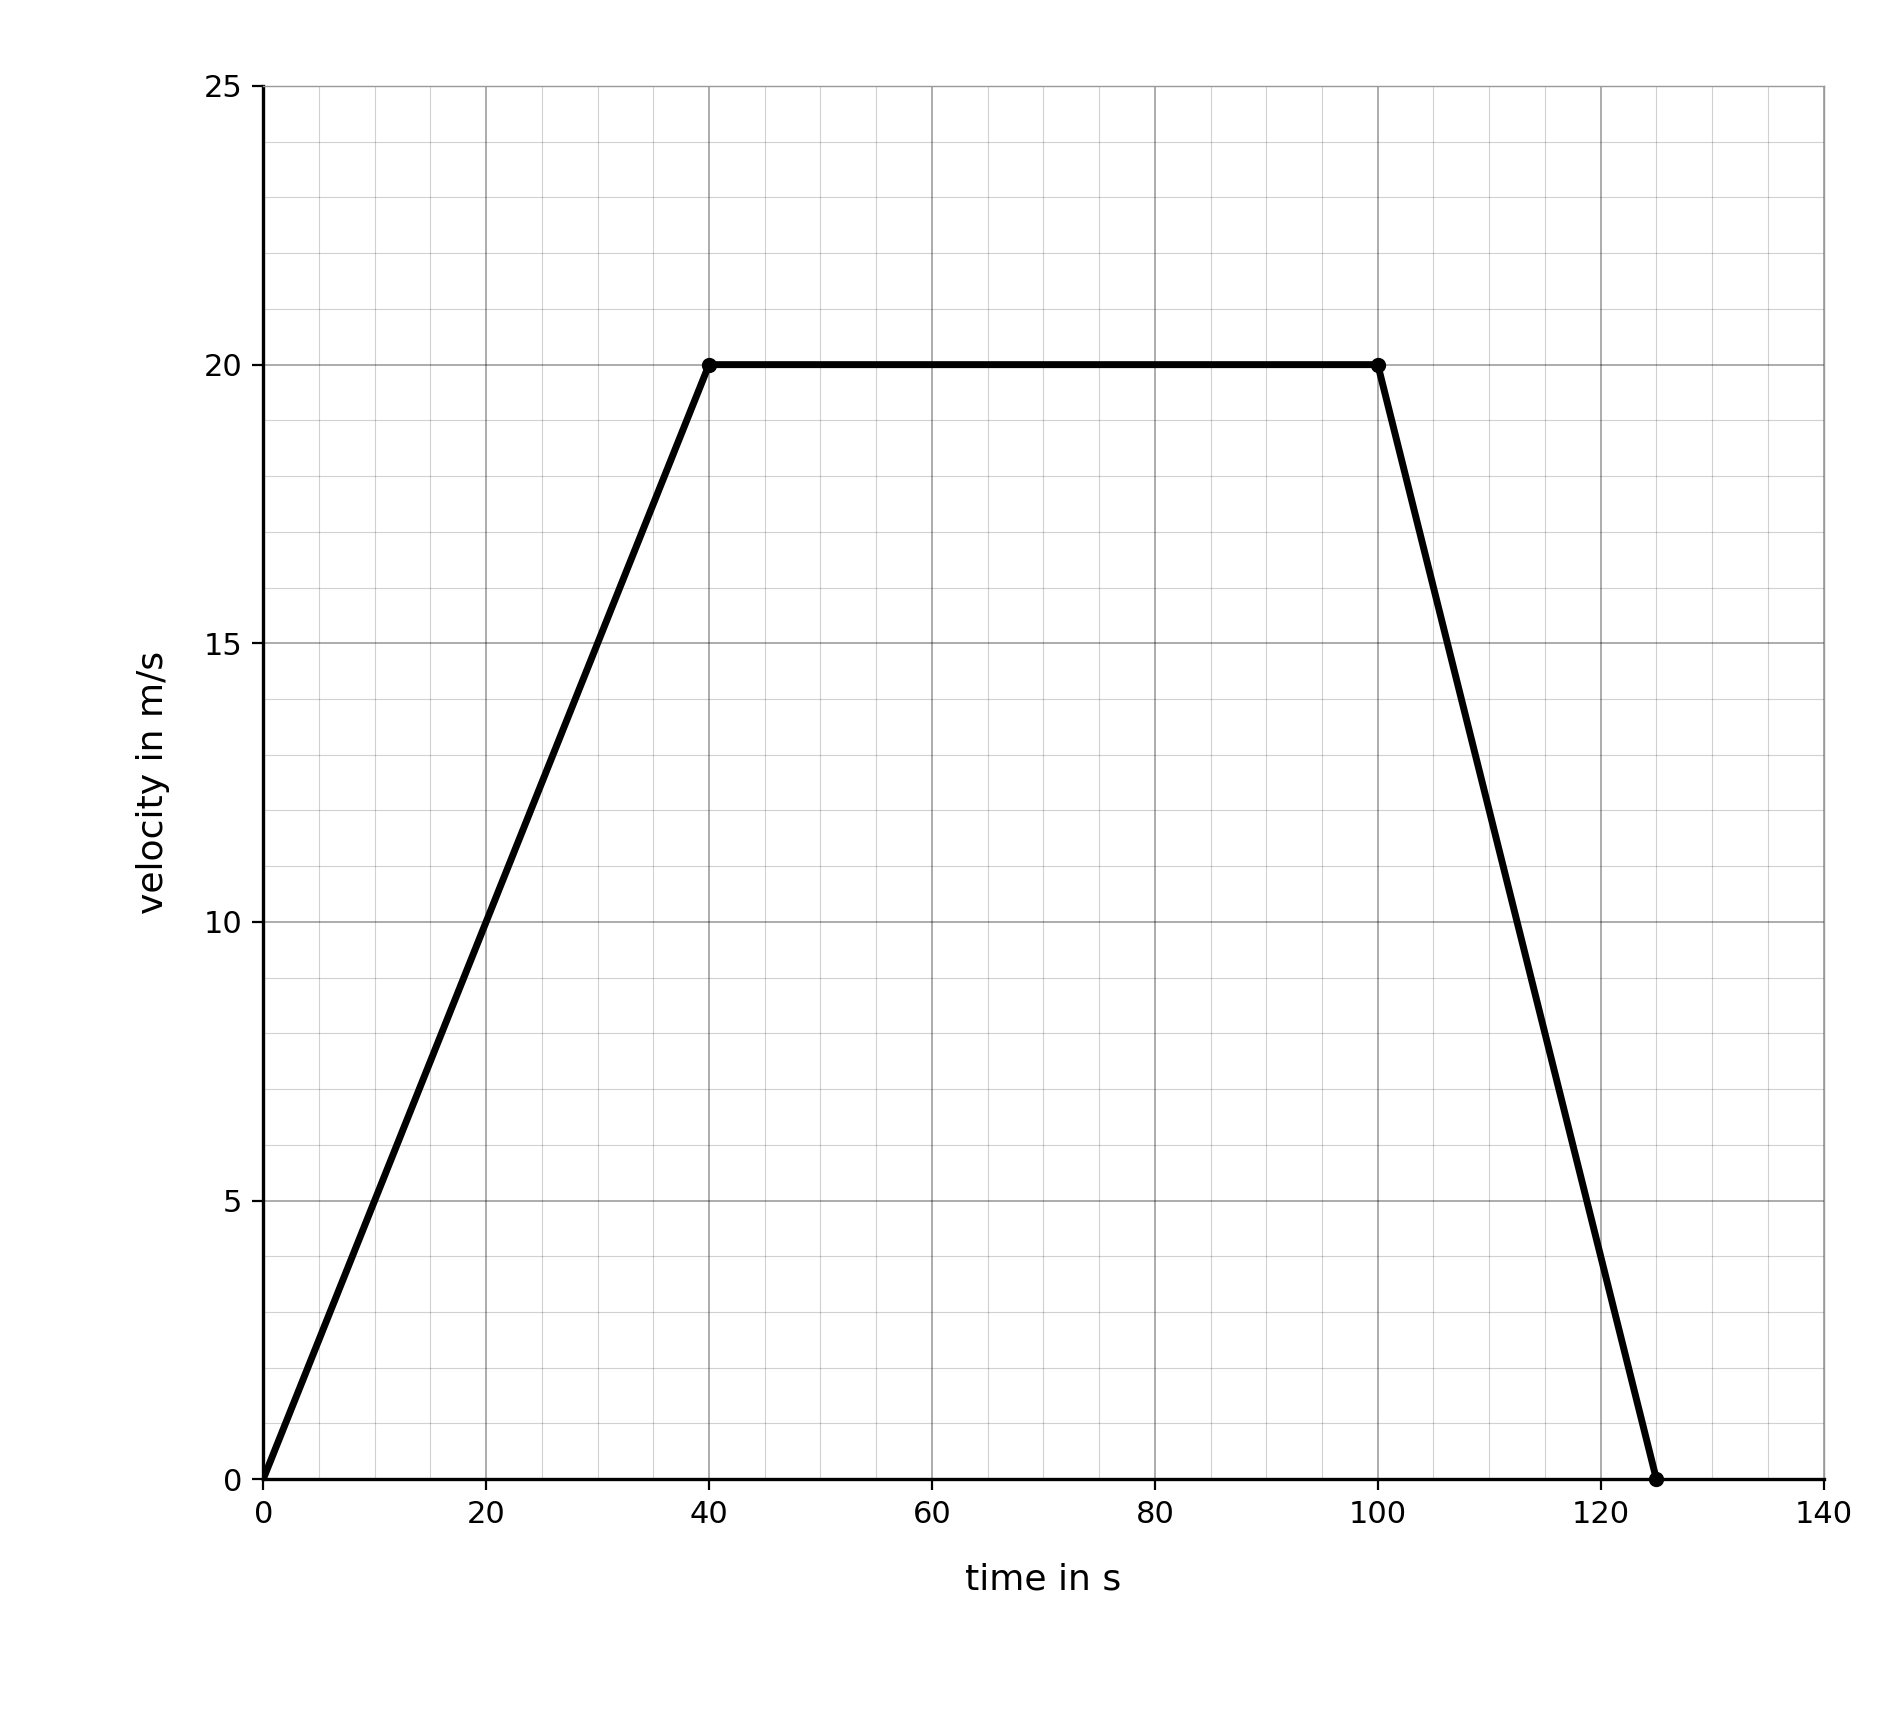
FA train travels between two stations along a straight track.
The Figure shows the velocity/time graph for the journey.
Figure
a.[1]
Describe the motion of the train between 40 s and 100 s.
b.[2]
Calculate the acceleration of the train in the first 40 s.
c.[2]
Explain how the graph shows that the deceleration of the train between 100 s and 125 s is greater than its acceleration in the first 40 s.
d.[2]
Determine the distance travelled by the train between 40 s and 100 s.
e.[3]
Determine the total distance travelled by the train between the two stations.
2.2 Speed, velocity and acceleration Questions
96 exam-style questions on Edexcel GCSE Physics 2.2 Speed, velocity and acceleration, covering 2.2.1 Speed and distance–time graphs, 2.2.2 Acceleration and the uniform-acceleration equation, 2.2.3 Velocity–time graphs, and 2.2.4 Measuring speed, typical speeds and free-fall acceleration. Each one has a worked solution and a mark scheme showing where the marks go.