Speed, velocity and acceleration

EasyMediumHard
12345678910111213141516171819202122232425262728293031323334353637383940414243444546474849505152535455565758
Question 51
Easy

The table and graph show the motion of two remote-controlled model cars, P and Q, during a straight-line race.
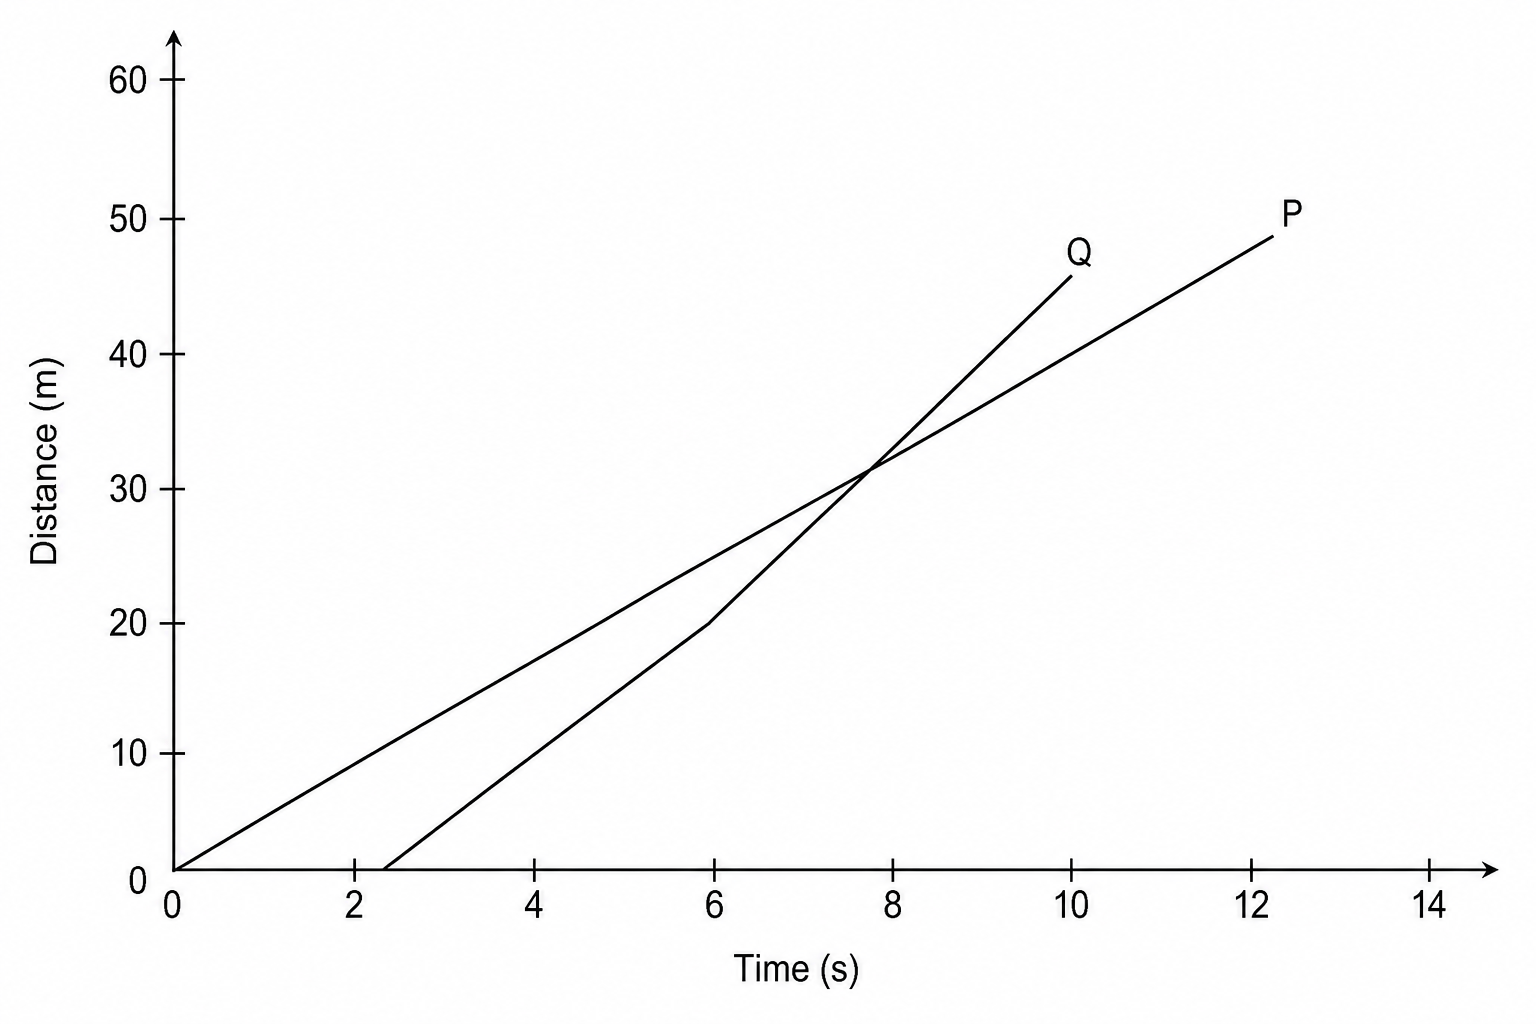
Distance-time graph showing the motion of two model cars, P and Q. Car P has a constant speed starting from (0,0) up to (12.5, 50). Car Q starts at 2 seconds from 0 meters and travels at a faster constant speed, intersecting Car P's line at (8 seconds, 32 meters) and continuing to the finish line.

Time (s)Distance of Car P (m)Distance of Car Q (m)
00-
280
41610
62420
83232
104044
1248-

State the distance that Car P has travelled when Car Q overtakes it.

[1]

Speed, velocity and acceleration Questions

  1. GCSE
  2. /Physics
  3. /Speed, velocity and acceleration