Resistance and circuit components

EasyMediumHard
12345678910111213141516171819202122232425262728293031323334
Question 30
Medium

A student investigates how the resistance of a Light Dependent Resistor (LDR) changes with light intensity. The results are shown in Figure 1.
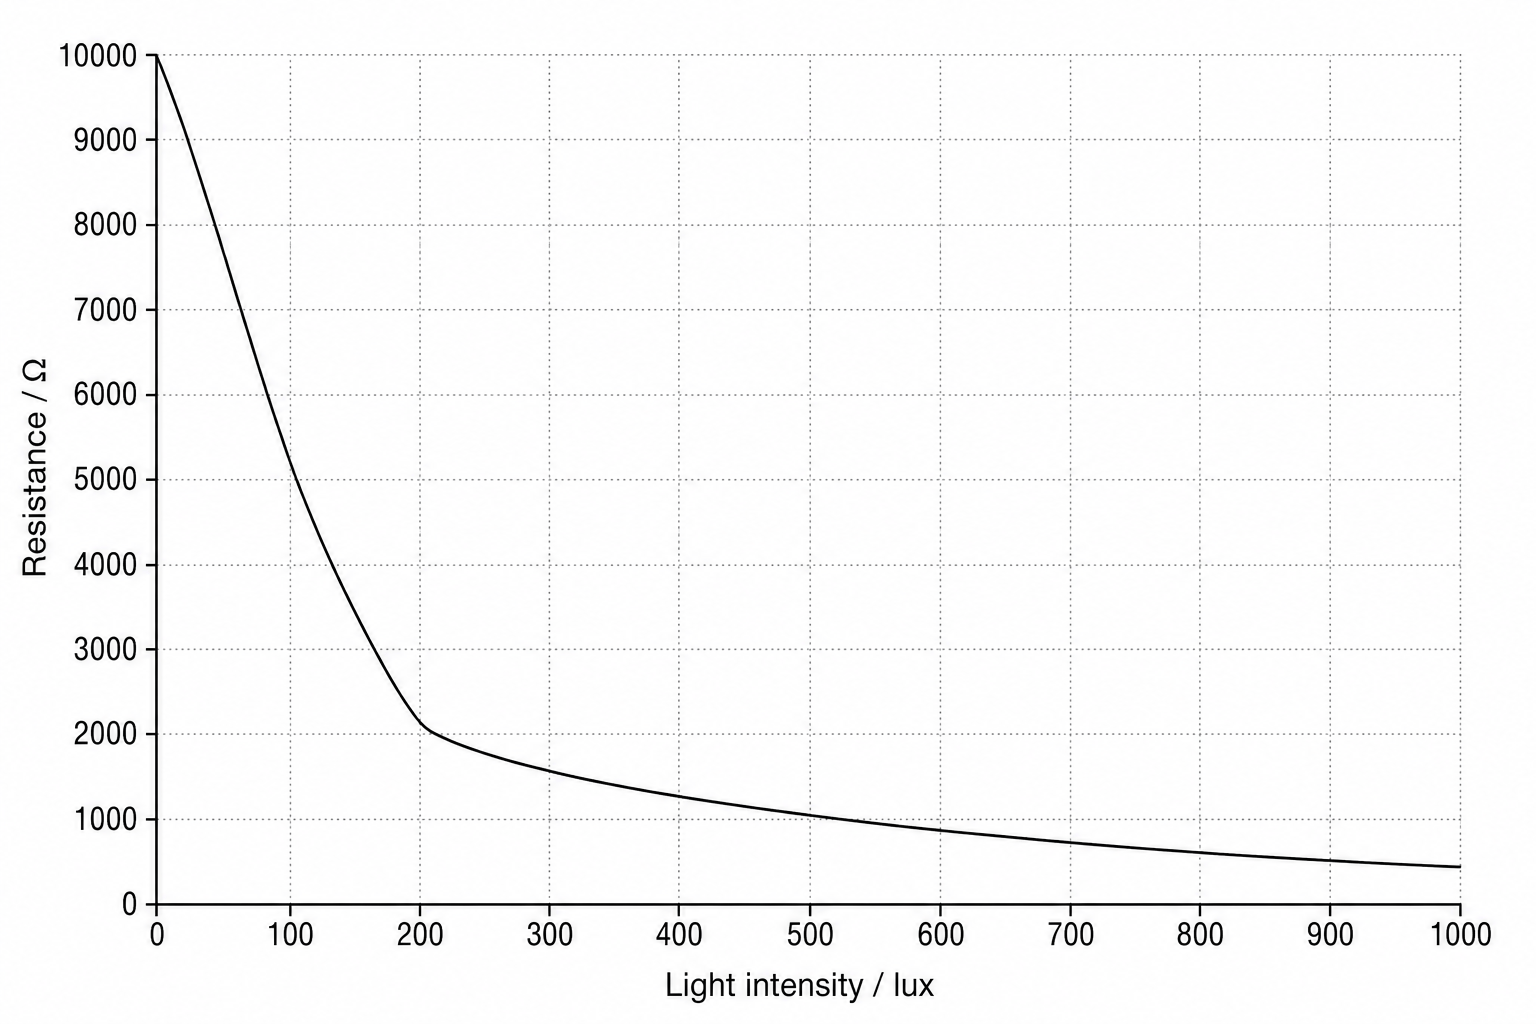
Figure 1: A line graph showing how the resistance of an LDR changes with light intensity. The x-axis is labeled 'Light intensity in lux' and runs from 0 to 1000 lux with grid intervals of 100 lux. The y-axis is labeled 'Resistance in ohms (\Omega)' and runs from 0 to 10,000 \Omega with grid intervals of 1000 \Omega. At 0 lux, the resistance is 10,000 \Omega. The curve drops rapidly to 2000 \Omega at 200 lux, and then decreases much more gradually to 400 \Omega at 1000 lux.

Comment on the relationship between the resistance of the LDR and the light intensity.

Use information from Figure 1 to support your answer.

[3]

Resistance and circuit components Questions

  1. GCSE
  2. /Physics
  3. /Resistance and circuit components