Resistance and circuit components

EasyMediumHard
12345678910111213141516171819202122232425262728293031323334
Question 26
Medium

The graph shows how the resistance of a light-dependent resistor (LDR) changes with light intensity.
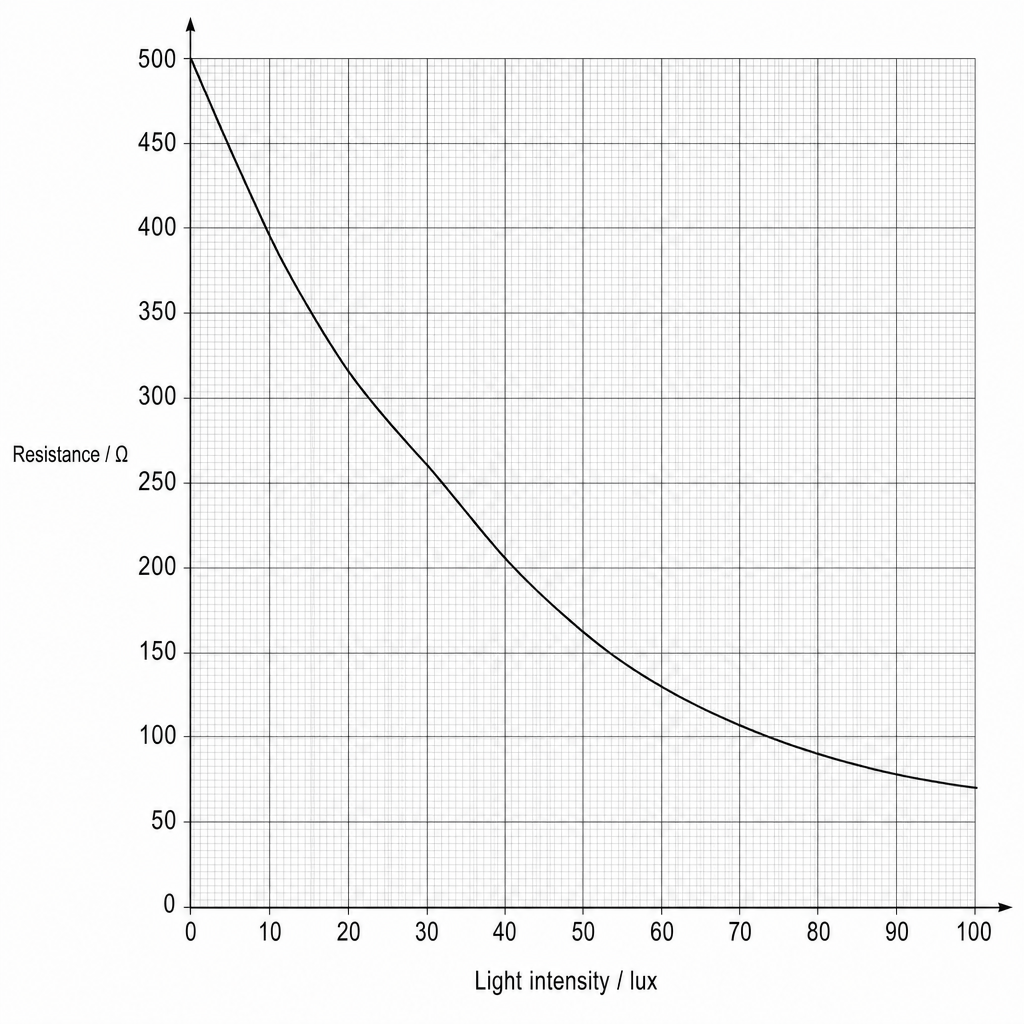
Graph showing a curve of resistance in ohms (Ω) on the y-axis against light intensity in lux on the x-axis. The y-axis ranges from 0 to 500 Ω with major grid lines every 50 Ω. The x-axis ranges from 0 to 100 lux with major grid lines every 10 lux. The descending curve starts near (0, 500) and smoothly declines through (20, 310), (40, 200), (60, 130), (80, 90), and ends near (100, 70).

Draw a tangent to the curve at a light intensity of 40 lux40\text{ lux}40 lux, and use it to find the rate of change of resistance with light intensity at 40 lux40\text{ lux}40 lux.

State the unit.

[3]

Resistance and circuit components Questions

  1. GCSE
  2. /Physics
  3. /Resistance and circuit components