A researcher investigates how the magnetic flux density, BBB, of a powerful neodymium magnet varies with distance, ddd, from its magnetic centre along its longitudinal axis.
The grid in Figure 1 shows the majority of the researcher's results plotted as a scatter diagram.
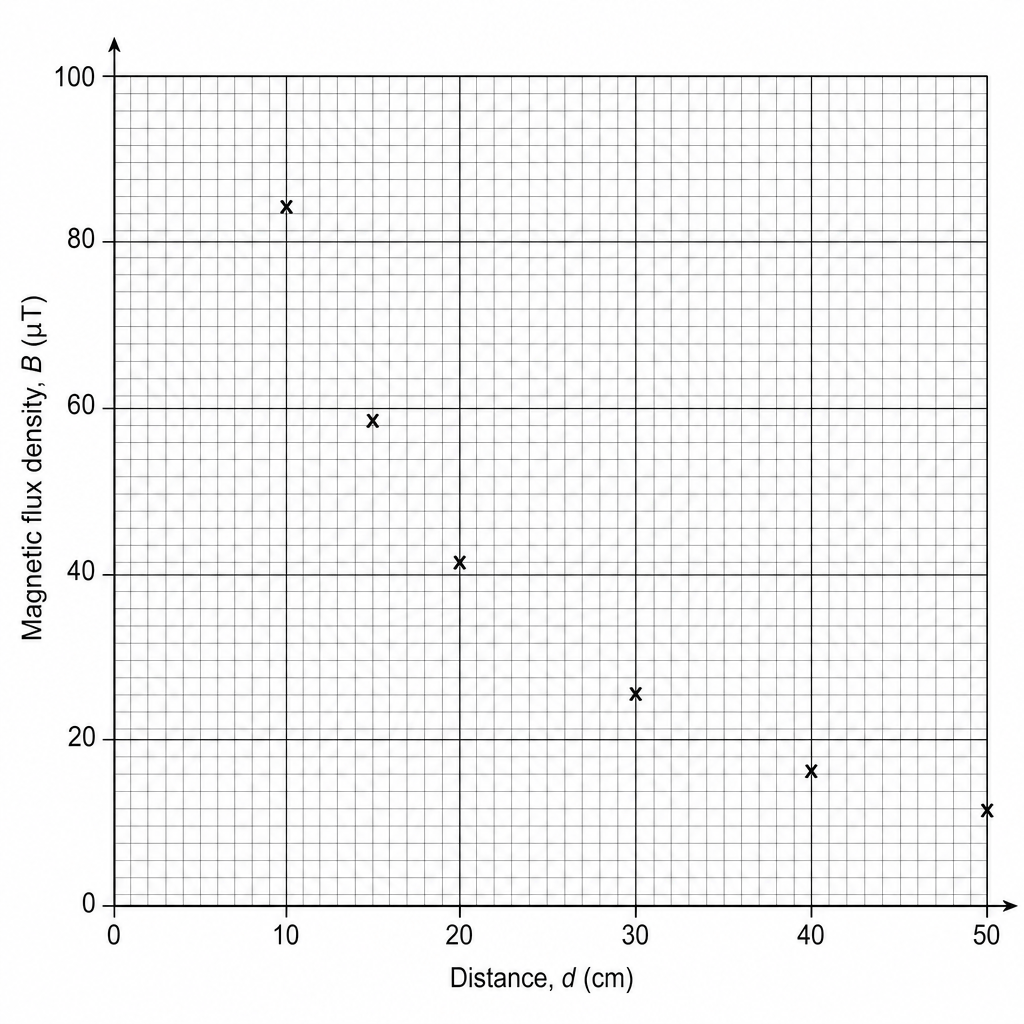
The table in Figure 2 displays two additional measurement data points.
Figure 2
| Distance, ddd (cm) | Magnetic flux density, BBB (μT\mu\text{T}μT) |
|---|---|
| 12 | 72 |
| 25 | 34 |
Plot the two additional data points from Figure 2 onto the graph in Figure 1.