Question 16
FA student separates a mixture of three liquids by fractional distillation. The liquids mix completely.
The graph shows the temperature at the top of the fractionating column during the distillation.
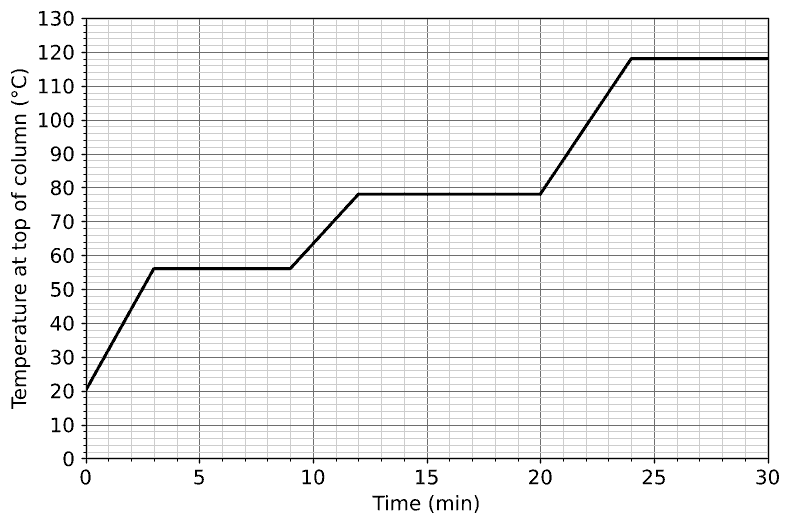
The table shows the boiling points of five liquids.
| Liquid | Boiling point (∘C^\circ\mathrm{C}∘C) |
|---|---|
| Propanone | 56 |
| Methanol | 65 |
| Ethanol | 78 |
| Propan-1-ol | 97 |
| Butan-1-ol | 118 |
Which liquids are in the flask at 15 minutes?
Butan-1-ol only
Ethanol and butan-1-ol
Ethanol and propan-1-ol
Propanone, ethanol and butan-1-ol
2.1 Purity and separating mixtures Questions
51 exam-style questions on OCR GCSE Chemistry 2.1 Purity and separating mixtures, covering 2.1.1 Pure substances and melting point data, 2.1.2 Relative formula mass and empirical formula, 2.1.3 Formulations as useful mixtures, 2.1.4 Techniques for separating mixtures, and 2.1.5 Chromatography and Rf values. Each one has a worked solution and a mark scheme showing where the marks go.