Question 4
HA chemist makes three batches of aspirin, A, B and C. Pure aspirin melts at 136 °C.
The chemist tests each batch by measuring its melting point and by thin layer chromatography (TLC).
The table shows the results.
| Batch | Melting point (°C) | Number of spots on the TLC plate |
|---|---|---|
| A | 129 to 133 | 2 |
| B | 136 | 1 |
| C | 131 to 134 | 1 |
a.[2]
Explain why batch B is likely to be pure aspirin.
b.[2]
The diagram shows the TLC plate for batch A.
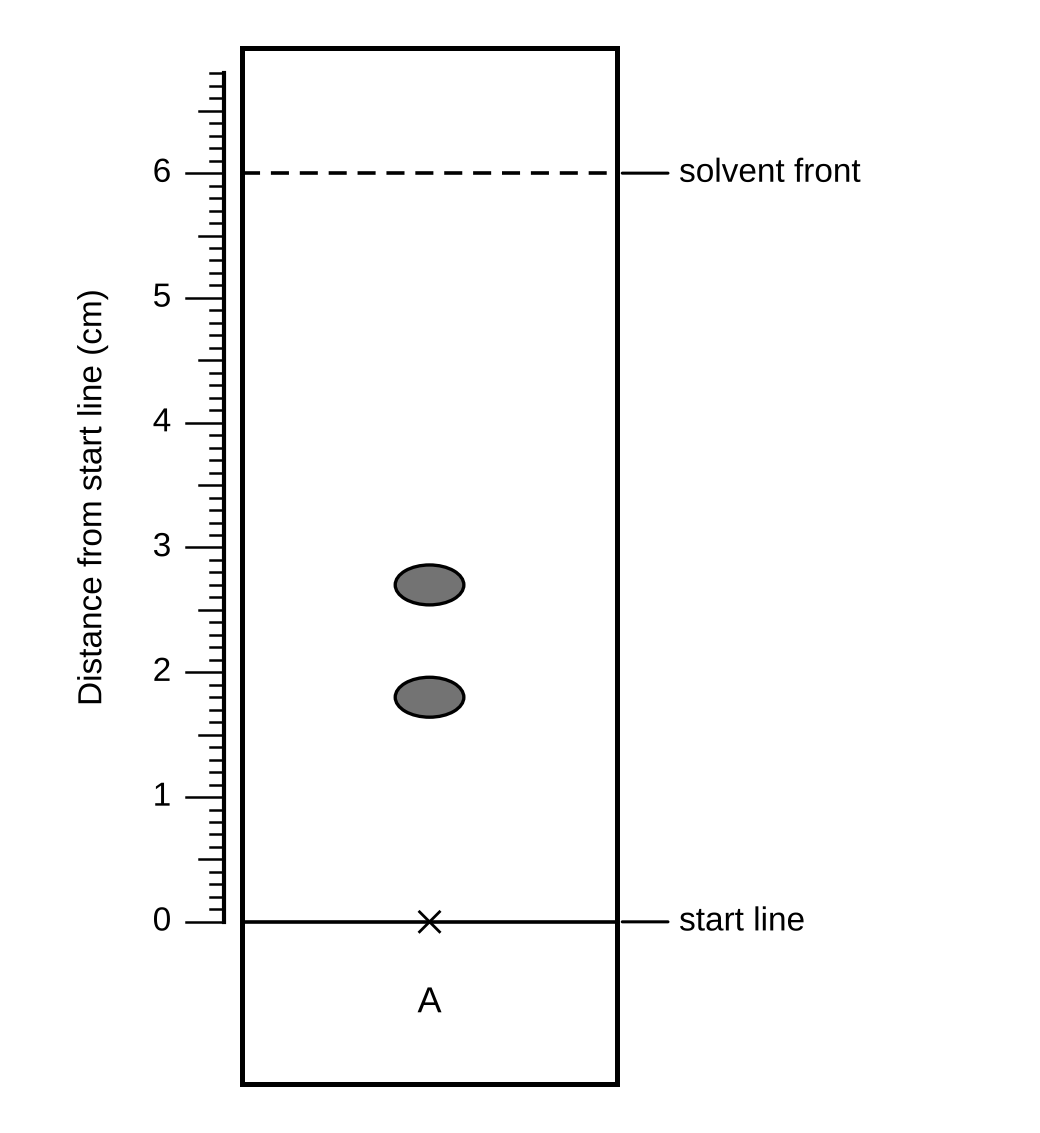
Calculate the Rf values of the two spots. Use the scale on the diagram.
c.
[1]
The table shows the Rf values of some substances in the same solvent.
| Substance | Rf value |
|---|---|
| aspirin | 0.45 |
| ethanoic acid | 0.62 |
| salicylic acid | 0.30 |
Use your answers to (b) to identify the impurity in batch A.
d.[3]
A student says, "Batch C is pure, because it gives only one spot on the TLC plate."
Evaluate the student's statement. Suggest how the chemist could use chromatography to check batch C.
e.[2]
Aspirin and salicylic acid move different distances up the TLC plate.
Explain why. Use ideas about the mobile phase and the stationary phase.
2.1 Purity and separating mixtures Questions
51 exam-style questions on OCR GCSE Chemistry 2.1 Purity and separating mixtures, covering 2.1.1 Pure substances and melting point data, 2.1.2 Relative formula mass and empirical formula, 2.1.3 Formulations as useful mixtures, 2.1.4 Techniques for separating mixtures, and 2.1.5 Chromatography and Rf values. Each one has a worked solution and a mark scheme showing where the marks go.