A chemist investigated the catalytic decomposition of hydrogen peroxide. The volume of oxygen gas collected was recorded at regular intervals.
Their results are shown in the table below:
| Time in seconds | Volume of gas in cm3\text{cm}^3cm3 |
|---|---|
| 0 | 0 |
| 15 | 24 |
| 30 | 42 |
| 45 | 54 |
| 60 | 61 |
| 75 | 64 |
| 90 | 64 |
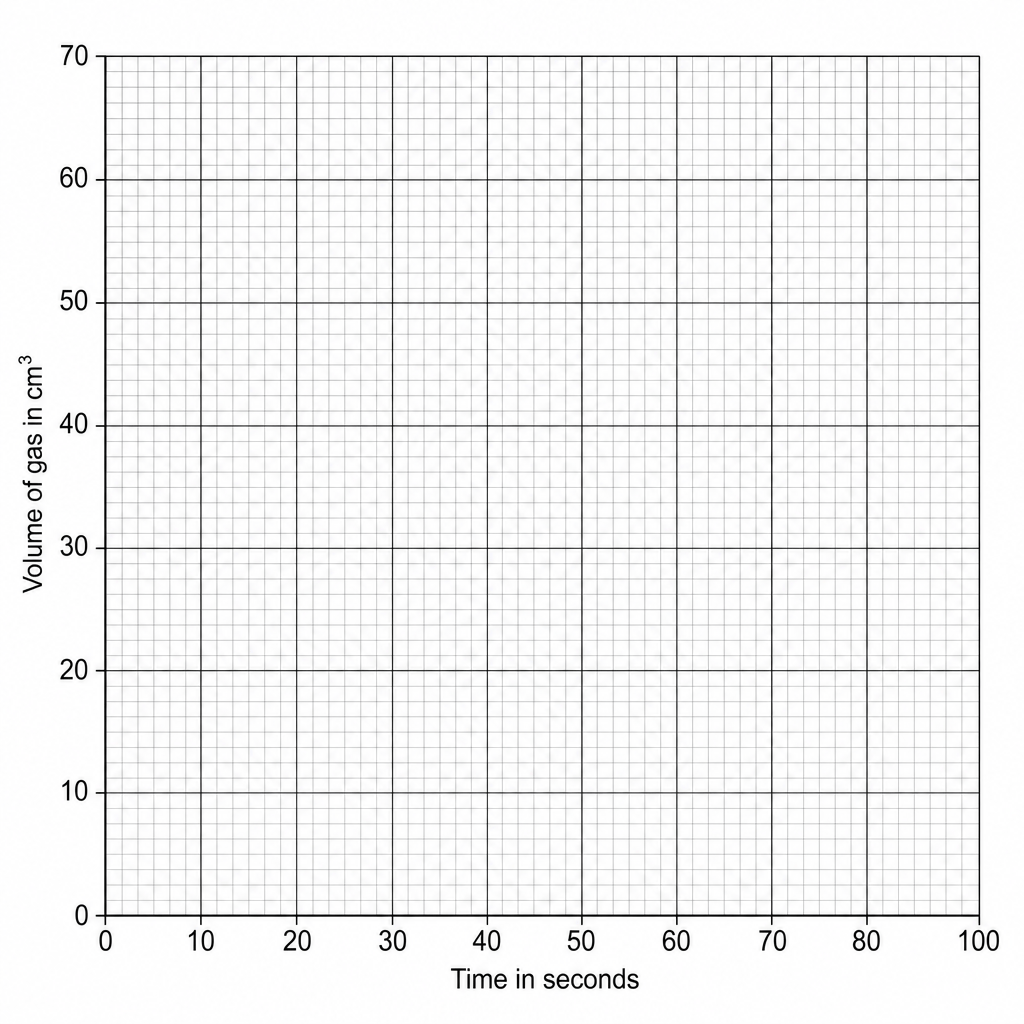
On the grid, plot the results shown in the table and draw a curve of best fit.
Practise Edexcel GCSE Chemistry Rates of reaction with exam-style questions for Foundation and Higher tier. 166 questions, matched to the Edexcel GCSE Chemistry (1CH0) specification and written in Paper 1 and Paper 2 style. Every question includes a full worked solution and mark scheme, so you can see where marks are awarded rather than just whether you got the answer right.

