An individual consumes a meal rich in starch and sucrose at t=0t = 0t=0 hours after an overnight fast. The graph below shows the relative changes in four physiological parameters over the subsequent 6 hours.
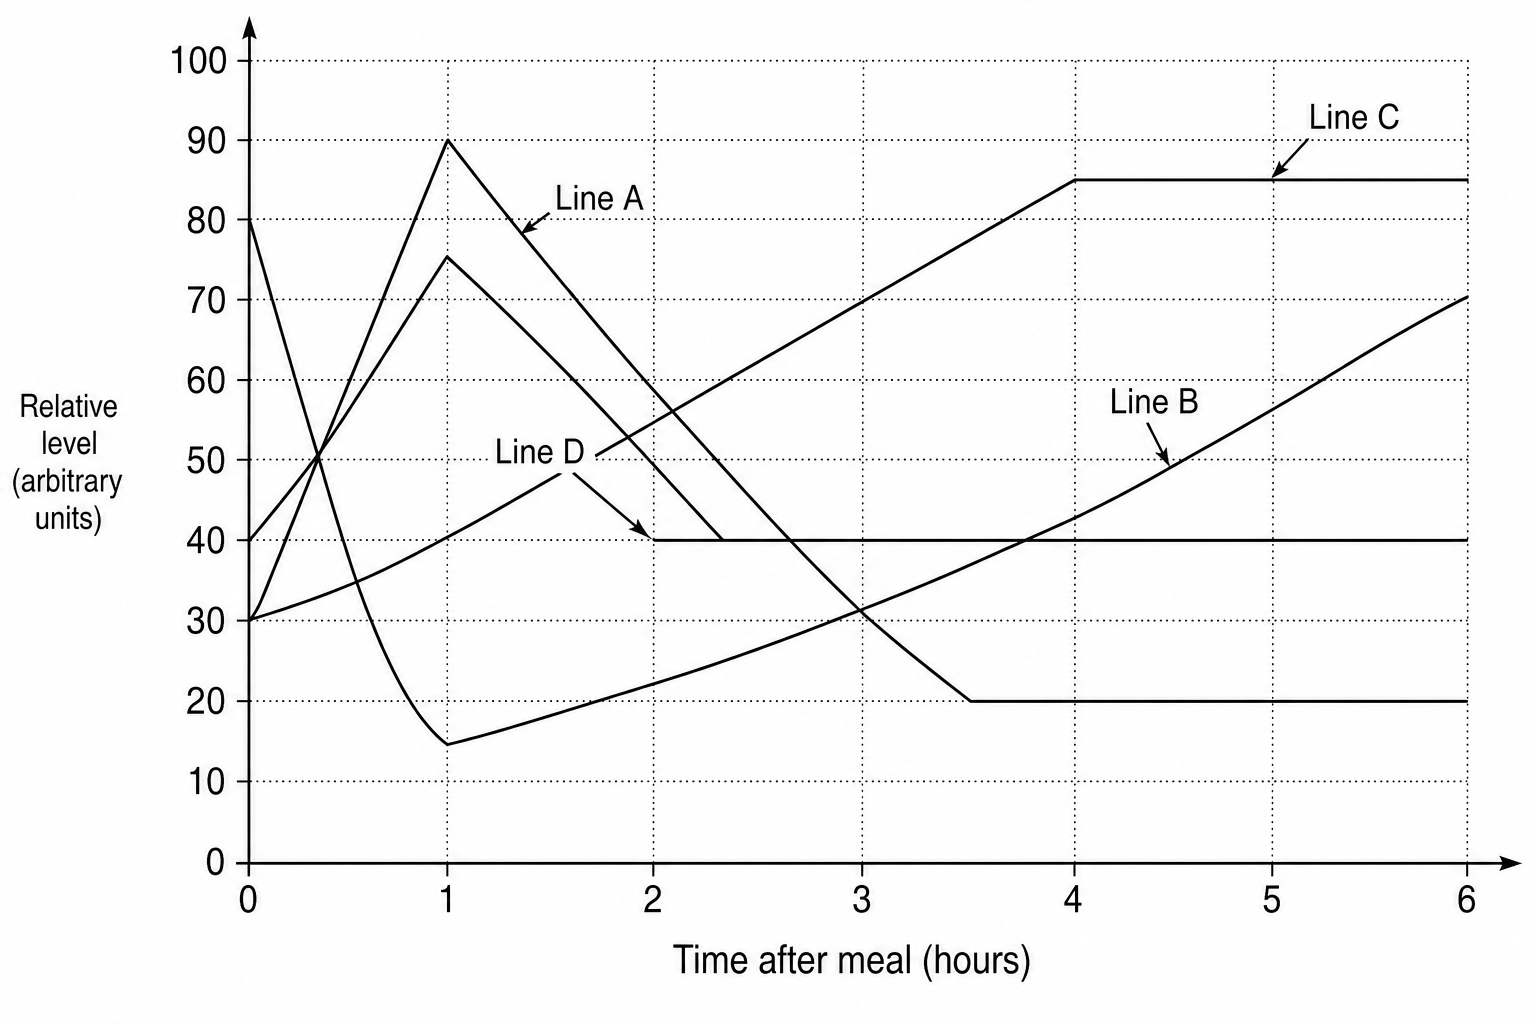
Which line on the graph represents the relative level of liver glycogen?
Line A
Line B
Line C
Line D