Question 1
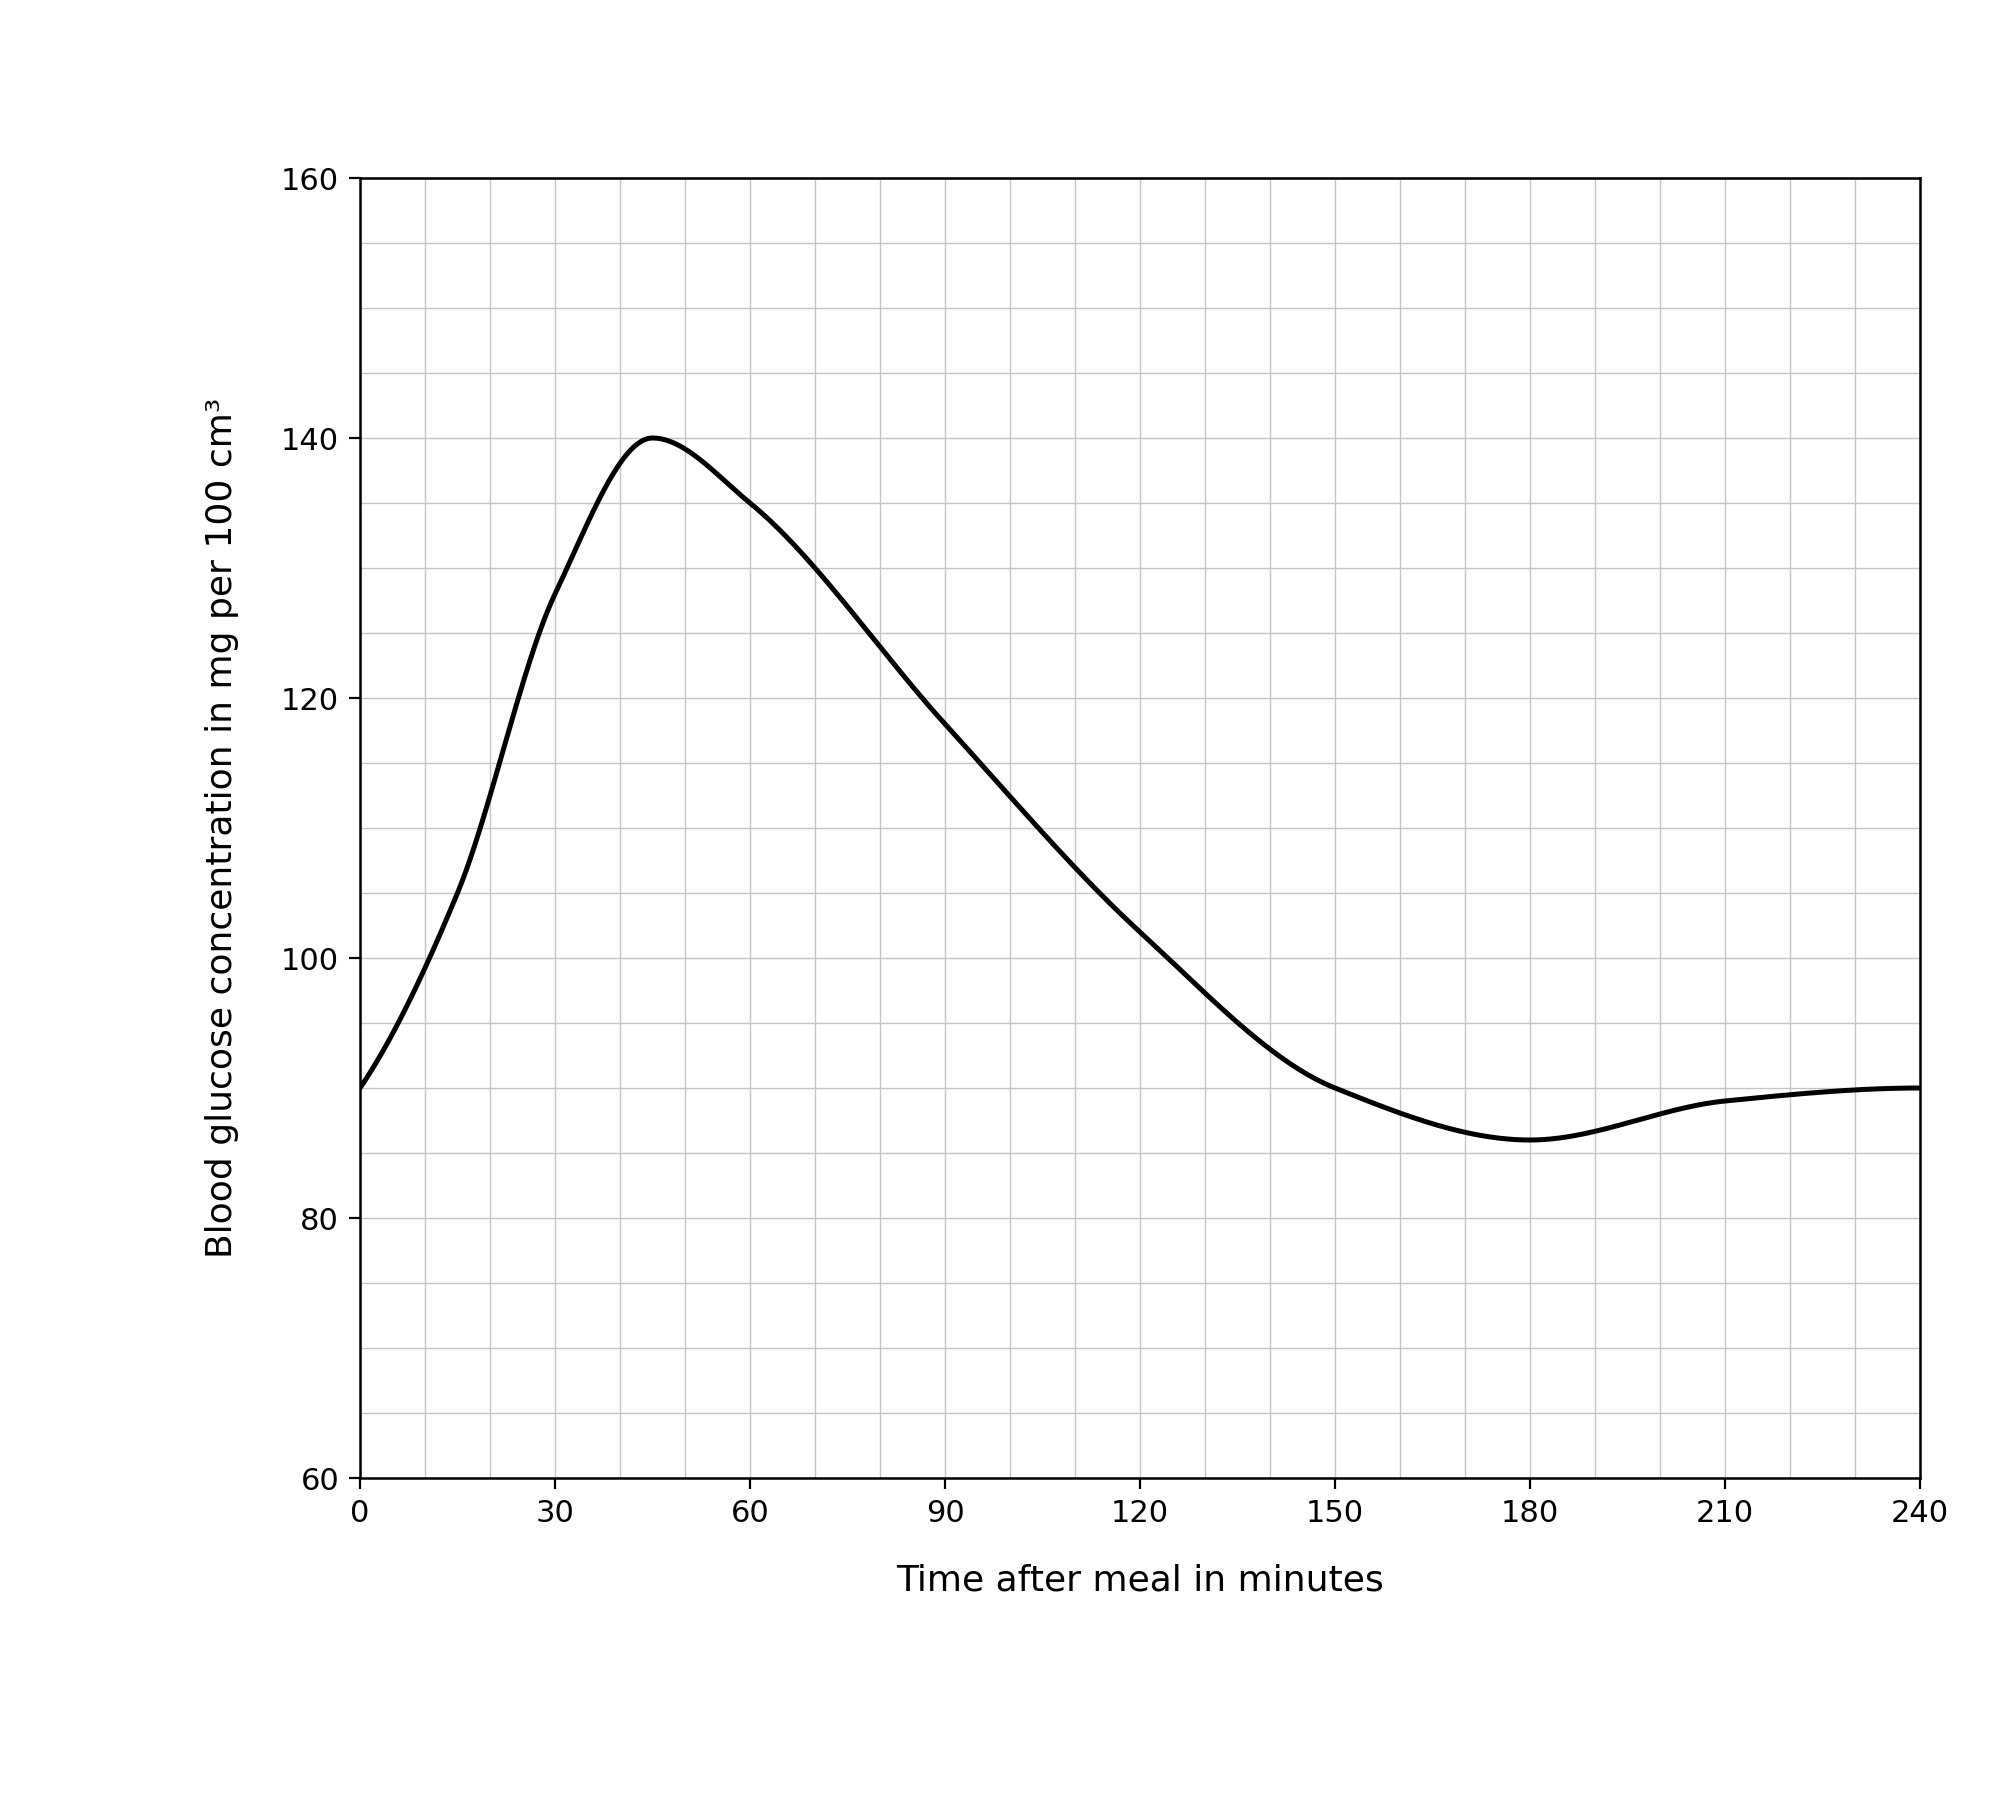
FA person eats a meal at 0 minutes.
The Figure shows the concentration of glucose in the person's blood for the next 4 hours.
Figure
a.[1]
Give the maximum blood glucose concentration shown in the Figure.
b.[2]
Calculate the rate of decrease in blood glucose concentration between 45 minutes and 150 minutes.
Give your answer in mg per 100 cm3 per minute, to 2 significant figures.
c.[1]
Name the organ that releases insulin.
d.[3]
Explain how insulin causes the blood glucose concentration to fall after 45 minutes.
3.3 Maintaining internal environments Questions
72 exam-style questions on OCR GCSE Biology 3.3 Maintaining internal environments, covering 3.3.1 Importance of a constant internal environment, 3.3.2 The skin and body temperature, 3.3.3 Insulin and blood sugar, 3.3.4 Glucagon and blood sugar, 3.3.5 Type 1 and type 2 diabetes, 3.3.6 Osmotic changes in body fluids, 3.3.7 Kidneys and water balance, 3.3.8 Structure of the kidney and tubule, 3.3.9 ADH and kidney tubule permeability, and 3.3.10 Responses to temperature and osmotic challenges. Each one has a worked solution and a mark scheme showing where the marks go.