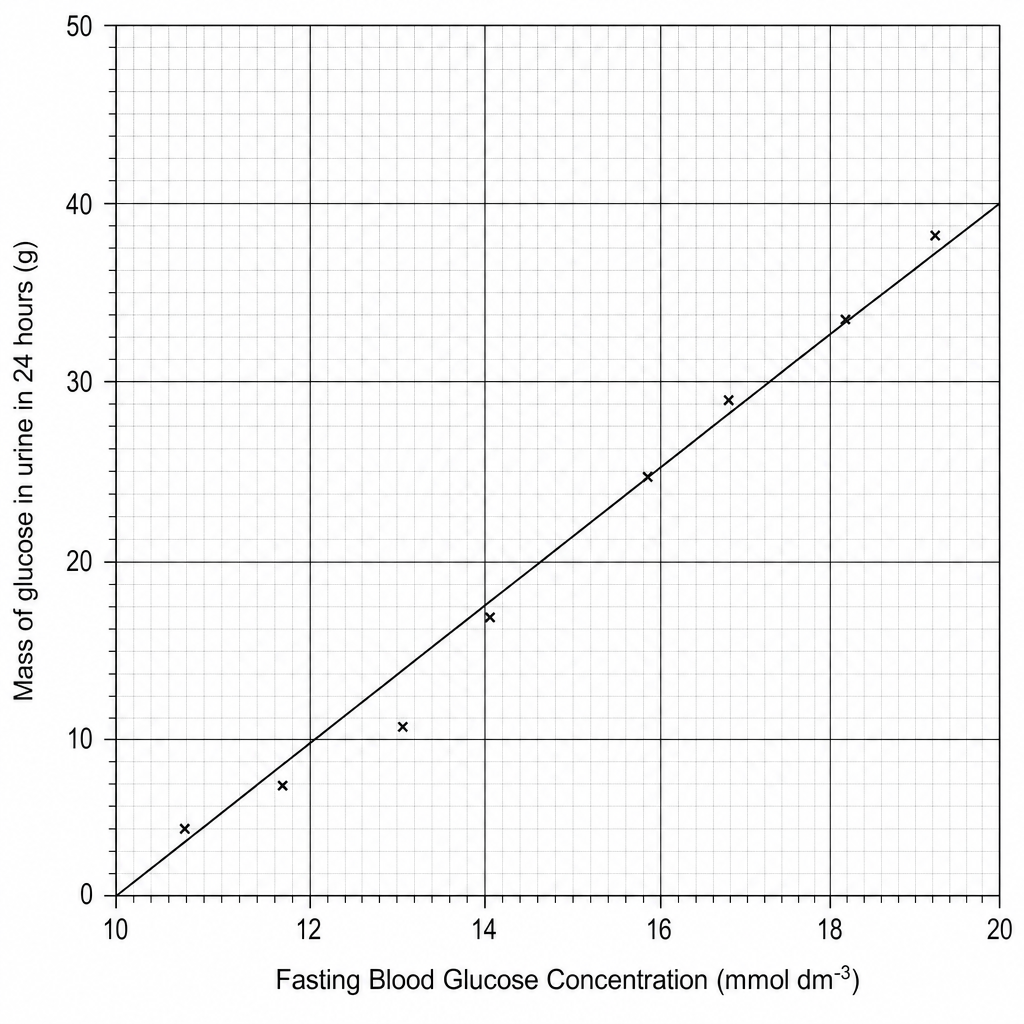
The graph below shows the mass of glucose excreted in the urine plotted against the Fasting Blood Glucose Concentration for eight patients with impaired glucose regulation.
a.[1]
What does the graph show about the relationship between Fasting Blood Glucose Concentration and the mass of glucose excreted in the urine?
b.[2]
A patient has a Fasting Blood Glucose Concentration of 16.0 mmol dm−316.0\text{ mmol dm}^{-3}16.0 mmol dm−3. They produce 1200 cm31200\text{ cm}^31200 cm3 of urine in 24 hours.
Calculate the concentration of glucose in this patient's urine using the line of best fit.