Fig. 22.1 shows the mass of sodium excreted in the urine in 24 hours plotted against the plasma aldosterone concentration for nine patients.
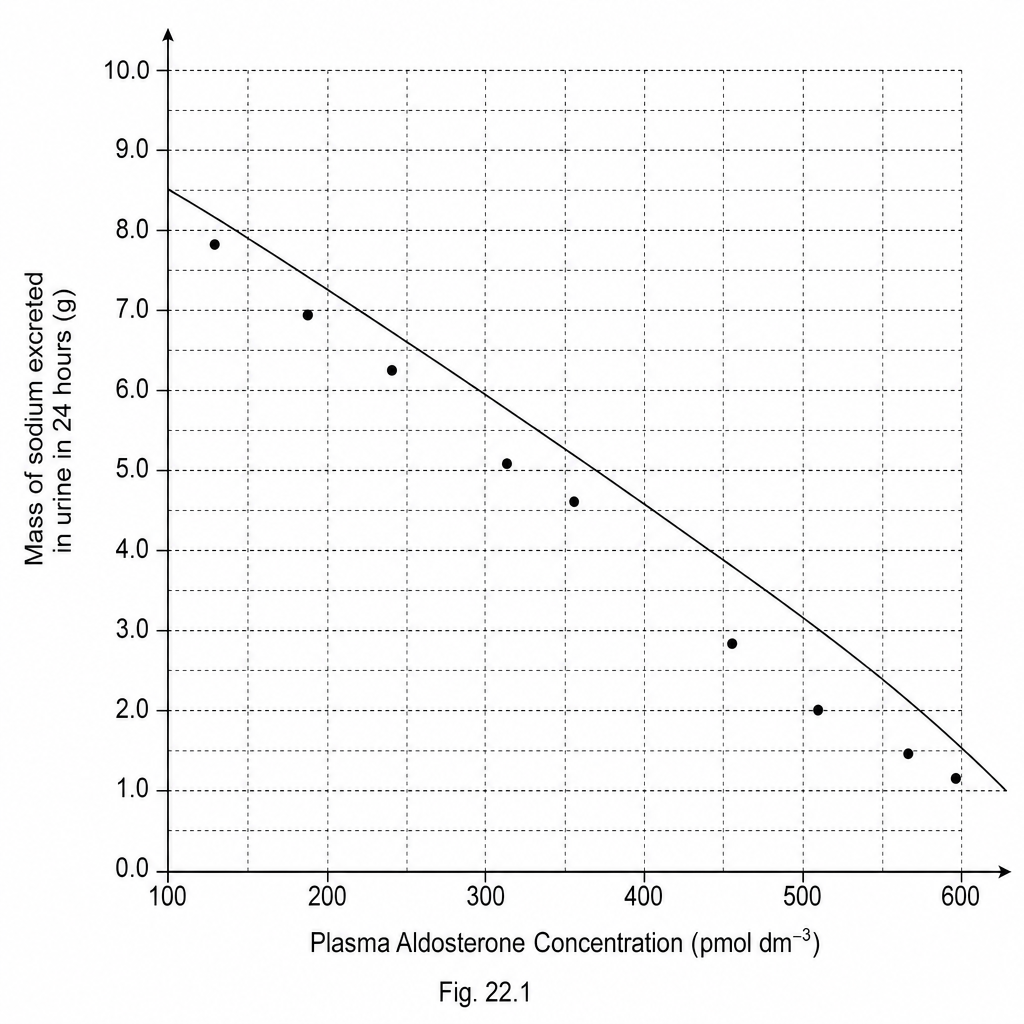
What does the graph show about the relationship between plasma aldosterone concentration and the mass of sodium excreted in the urine?
A patient has a plasma aldosterone concentration of 400 pmol dm−3400\text{ pmol dm}^{-3}400 pmol dm−3. They produce 1.6 dm31.6\text{ dm}^31.6 dm3 of urine in 24 hours.
Using Fig. 22.1, calculate the concentration of sodium in this patient's urine.
Concentration = _______ g dm−3\text{g dm}^{-3}g dm−3.
During ultrafiltration and selective reabsorption, the filtrate passes through several structures of the nephron. Put a number (1 to 5) in the boxes to show the order of the structures that the filtrate passes through. The first one has been done for you.
- Bowman's capsule: 1
- Loop of Henle: [ ]
- Proximal convoluted tubule: [ ]
- Collecting duct: [ ]
- Distal convoluted tubule: [ ]