GCSE Food and Nutrition Gender Gap Results
GCSE food and nutrition gender gap results show a clear national difference. Explore the 2025 data and learn how to interpret percentages for GCSE maths.
A national result can look like a verdict. It is better understood as a question.
The latest GCSE food and nutrition gender gap results show that female candidates in England were more likely than male candidates to reach several important grade thresholds in summer 202520252025. The difference was particularly large at grade 444 or above. There were also considerably more female entries.
That is the short answer: yes, the national data shows a clear gap. But the figures do not tell us that every girl performs better than every boy, nor do they explain what caused the difference. Reading them properly requires the same habits that help with GCSE maths: checking denominators, comparing percentages and refusing to confuse correlation with causation.
The results at a glance
The latest available subject-level figures published by the Joint Council for Qualifications cover summer 202520252025. The table below uses the England results for Food Preparation and Nutrition.
| Measure | Female entries | Male entries | Difference |
|---|---|---|---|
| Number of entries | 32,13132,13132,131 | 22,31622,31622,316 | 9,8159,8159,815 more female entries |
| Grade 999 | 1.15%1.15\%1.15% | 0.78%0.78\%0.78% | 0.370.370.37 percentage points |
| Grade 777 or above | 15.59%15.59\%15.59% | 5.19%5.19\%5.19% | 10.4010.4010.40 percentage points |
| Grade 444 or above | 62.92%62.92\%62.92% | 39.65%39.65\%39.65% | 23.2723.2723.27 percentage points |
Across male and female candidates combined, there were 54,44754,44754,447 entries. Of these, 11.33%11.33\%11.33% achieved grade 777 or above and 53.38%53.38\%53.38% achieved grade 444 or above.
A useful checklist for interpreting these figures is:
- identify the population, which here is GCSE entries in England;
- check whether figures are counts, percentages or percentage-point differences;
- compare the same grade threshold for both groups;
- look at more than one year before calling something a trend;
- separate what the data shows from possible explanations;
- remember that a group average cannot predict an individual result.
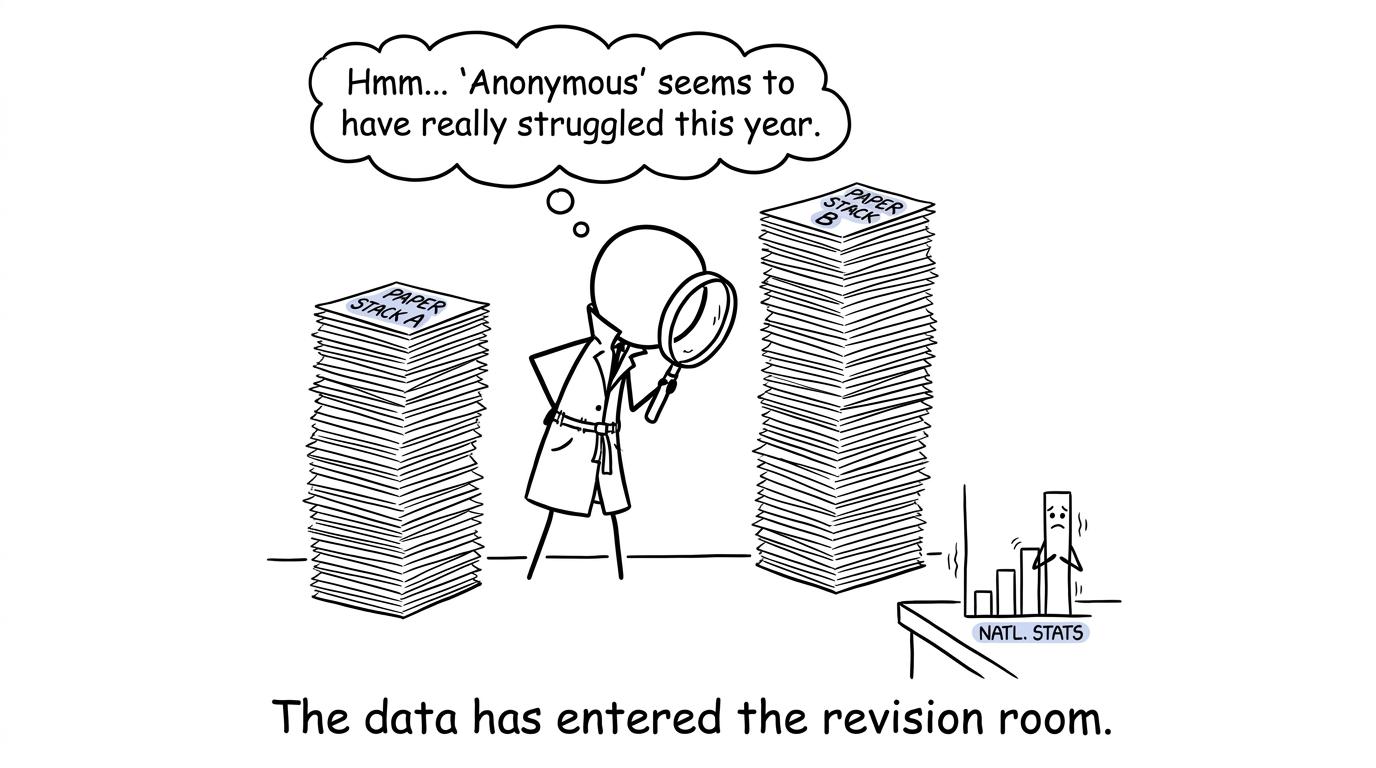 A student detective investigates national exam data while a bar chart hides behind a desk
What the national Food and Nutrition data shows
Female candidates were the larger entry group
Female candidates accounted for approximately 59.0%59.0\%59.0% of the combined male and female entries, while male candidates accounted for about 41.0%41.0\%41.0%.
The proportions are found using:
Group percentage=group entriestotal entries×100\text{Group percentage}=\frac{\text{group entries}}{\text{total entries}}\times 100Group percentage=total entriesgroup entries×100This is an entry gap as well as an attainment gap. It tells us that the subject was taken by more female candidates, but it does not tell us why students made those choices.
Entry figures should also be described accurately. They count subject entries rather than every girl or boy of GCSE age. Saying that 59.0%59.0\%59.0% of Food Preparation and Nutrition entries were female is not the same as saying that 59.0%59.0\%59.0% of all female students took the subject.
The largest attainment difference appeared at grade 444
In summer 202520252025, 62.92%62.92\%62.92% of female entries achieved grade 444 or above, compared with 39.65%39.65\%39.65% of male entries.
The percentage-point gap is:
62.92−39.65=23.2762.92-39.65=23.2762.92−39.65=23.27So the correct description is a gap of 23.2723.2723.27 percentage points. It would be inaccurate to call this a 23.27%23.27\%23.27% difference because percentage change is a different calculation with a chosen starting value.
Grade 444 is an important reporting threshold in GCSE results. However, Food Preparation and Nutrition itself is not split into foundation and higher tier in the way GCSE maths is. Students take the same tier of qualification, so this result cannot be explained by different proportions entering foundation or higher papers.
A substantial gap remained at higher grades
At grade 777 or above, the female result was 15.59%15.59\%15.59% and the male result was 5.19%5.19\%5.19%. That produces a difference of 10.4010.4010.40 percentage points.
The gap at grade 999 was much smaller: approximately 0.370.370.37 percentage points. This is a reminder that a gender difference need not remain the same across the whole grade distribution. A headline based on one threshold cannot summarise every grade.
For students developing their data skills, Edexcel GCSE Statistics revision provides questions, worksheets and papers covering data collection, representation and interpretation. Students on other specifications can begin with the broader GCSE Statistics revision hub.
Is the gap consistent over time?
One year can be unusual. Comparing summer 202520252025 with summer 202420242024 gives the claim more context.
| Grade threshold | Female 202420242024 | Male 202420242024 | Gap in 202420242024 | Gap in 202520252025 |
|---|---|---|---|---|
| Grade 777 or above | 14.92%14.92\%14.92% | 4.42%4.42\%4.42% | 10.5010.5010.50 percentage points | 10.4010.4010.40 percentage points |
| Grade 444 or above | 61.19%61.19\%61.19% | 38.00%38.00\%38.00% | 23.1923.1923.19 percentage points | 23.2723.2723.27 percentage points |
The two annual comparisons are remarkably similar. This supports the careful conclusion that the gap persisted across both years. It does not establish that it will continue indefinitely, and two data points alone are not enough to explain a long-term pattern.
When examining results over several years, a line graph can make changes clearer. A bar chart is usually better for comparing separate groups within one year. Choosing the correct representation is part of statistical reasoning, not merely presentation.
MathsGenie's scatter graphs lesson is useful for understanding relationships between variables. You can then test the skill with scatter graph practice questions.
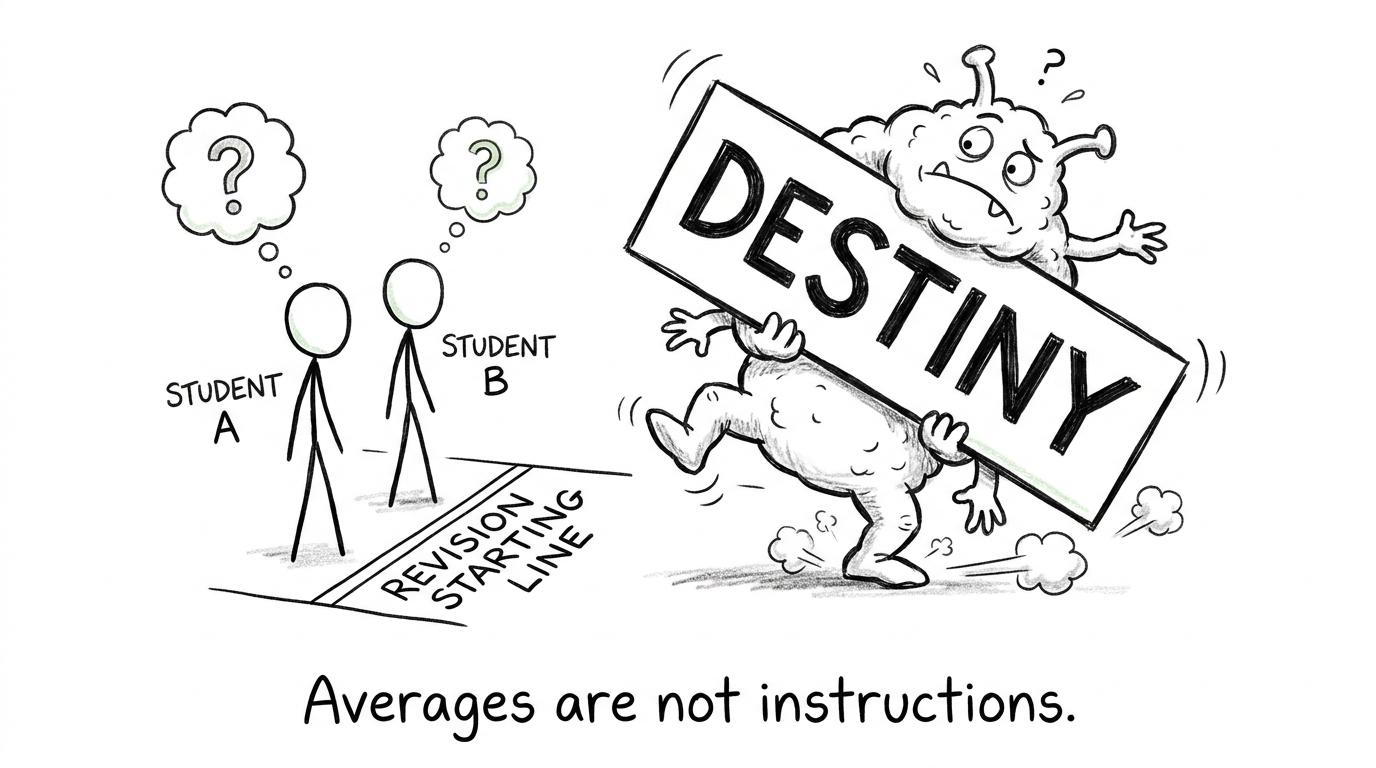 Two students ignore a stereotype monster carrying a destiny sign
What the results cannot tell us
National results describe outcomes. They do not identify causes.
Food Preparation and Nutrition combines written assessment with non-exam assessment. Differences in preparation, subject choice, attendance, engagement with assessment or other educational circumstances could potentially matter. Yet the national result table does not measure those factors, so it cannot tell us which explanations are correct.
The data also does not show:
- the distribution of prior attainment within each group;
- differences between schools or exam boards;
- how much progress individual candidates made;
- students' access to teaching time or facilities;
- the effect of socioeconomic background or additional educational needs;
- whether one assessment component contributed more to the overall difference.
The official tables use the categories male and female and describe the variable as sex. The phrase “gender gap” is widely used when discussing educational attainment, but careful reporting should retain the terminology and categories used in the source data.
Most importantly, these are overlapping groups containing thousands of different candidates. Many male candidates achieved high grades, while many female candidates did not reach the reported thresholds. The figures describe proportions, not limits on anyone's ability.
Why this matters for GCSE maths revision
Food and Nutrition results may seem distant from algebra or geometry, but interpreting this dataset uses several core GCSE maths skills.
Percentages and proportional reasoning
A raw count cannot be compared fairly when group sizes differ. There were more female entries, so comparing only the number of grade 777 results would be misleading. Percentages place each result relative to its own group total.
Percentage points versus percentage change
If two attainment rates are a%a\%a% and b%b\%b%, their percentage-point difference is:
Percentage-point difference=a−b\text{Percentage-point difference}=a-bPercentage-point difference=a−bPercentage change instead uses:
Percentage change=new value−original valueoriginal value×100\text{Percentage change}=\frac{\text{new value}-\text{original value}}{\text{original value}}\times 100Percentage change=original valuenew value−original value×100These answer different questions. GCSE examiners often reward students who name the comparison precisely.
Correlation and causation
An association between sex and subject outcome does not prove that sex caused the result. Other variables may be involved, and national summary tables do not control for them. The same caution applies when interpreting a scatter graph: correlation can suggest a relationship, but it does not establish causation.
Probability and individual outcomes
A group percentage is not a prediction for a particular student. If 15.59%15.59\%15.59% of one group reached grade 777 or above, that does not assign each member a fixed personal probability of 0.15590.15590.1559. Students differ in preparation, knowledge and circumstances.
You can strengthen this distinction using the GCSE probability revision guide, which explains how probabilities support estimates without guaranteeing individual results.
Common mistakes when reading gender-gap results
Comparing counts without checking group sizes
More female candidates entered the subject. A larger number of high grades could partly reflect that larger entry group. Use percentages when comparing attainment rates.
Saying “per cent” when the unit is percentage points
The difference between 62.92%62.92\%62.92% and 39.65%39.65\%39.65% is 23.2723.2723.27 percentage points. Always state the correct unit.
Treating an average as a rule
National patterns do not determine an individual candidate's grade. A student is not an average, and revision decisions should be based on their own marked work.
Claiming that the data proves a cause
The table shows an association. It does not reveal why the difference exists. A causal claim would require further evidence and a more detailed research design.
Mixing populations or years
England, Wales and Northern Ireland have different qualification contexts and published breakdowns. Compare figures from the same nation, subject, year and grade threshold.
Assuming every GCSE is tiered
GCSE maths has foundation and higher tiers, but GCSE Food Preparation and Nutrition is untiered. Importing the maths tier structure into this dataset would create a false explanation.
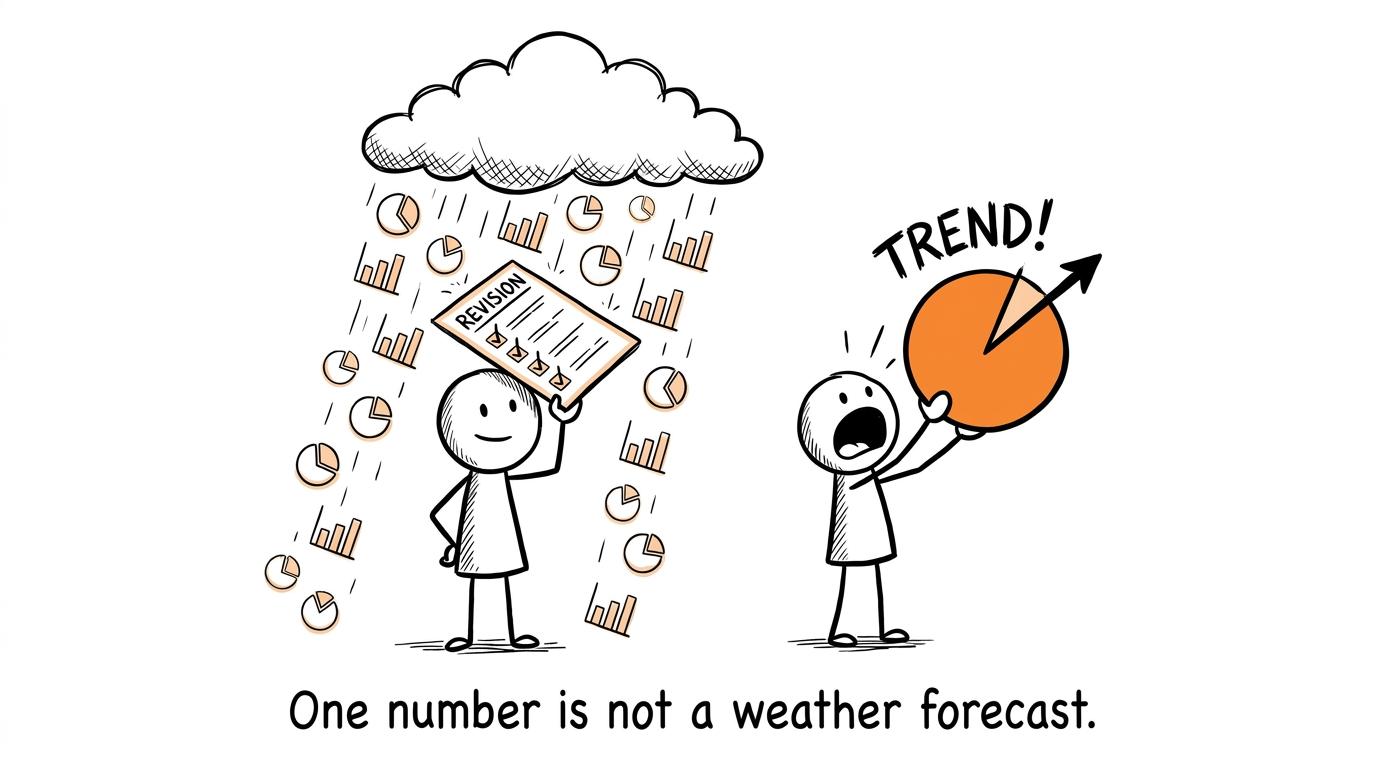 A student shelters under a revision checklist as charts rain from a cloud
Turn national data into better personal evidence
The most useful lesson is not about predicting who will succeed. It is about learning to trust the right evidence.
For your maths revision, that evidence is a marked paper. Complete a short set, identify where marks were lost and practise the smallest skill that repairs the problem. MathsGenie's guide to finding your weakest GCSE topics explains how to build this diagnostic loop.
Once your topic knowledge is secure, use Edexcel GCSE Maths predicted papers or the equivalent resources for your board. Sit the paper under timed conditions, use the mark scheme, watch video solutions where needed and return to targeted practice questions.
The national Food and Nutrition data shows a real, persistent difference between male and female outcomes in 202420242024 and 202520252025. It deserves careful investigation, not a stereotype. For an individual student, the more useful question remains simpler: which marks can I recover next?
Start at MathsGenie and build your answer through free revision lessons, practice questions, mini tests, past papers, predicted papers and mark schemes. National averages describe the crowd. Good revision changes what happens on your own paper.