GCSE Business Gender Gap Results: What Data Shows
GCSE business gender gap results explained with 2025 national data, careful comparisons and practical maths revision advice for students across the UK.
A results headline can make a national pattern feel personal. If one group achieves a higher percentage of top grades, it is easy to wonder whether the same outcome is somehow expected of you. The latest GCSE business gender gap results do show differences, but they do not predict any individual student's grade.
In England's summer 2025 GCSE Business results, female candidates had higher attainment rates at grades 999, 777 and above, and 444 and above. Male candidates, however, made up a considerably larger share of entries. Those are two different findings: one concerns outcomes, while the other concerns participation.
Understanding that distinction is useful beyond Business. It is exactly the kind of careful reasoning needed when interpreting percentages, tables and graphs in GCSE Maths.
The GCSE Business results at a glance
Here is the short version of what the latest available national subject data shows:
- Female candidates achieved higher percentages at the main grade thresholds in GCSE Business in England in 2025.
- At grades 777 to 999, the female attainment rate was about 4.74.74.7 percentage points higher.
- At grades 444 to 999, the difference was about 2.82.82.8 percentage points.
- More male candidates took GCSE Business: approximately 60.9%60.9\%60.9% of the male and female entries in the England table were male.
- The attainment gaps at grades 777 and 444 narrowed compared with 2024.
- The data describes groups of examination entries, not the ability or likely result of an individual student.
Students who want to explore how statistics are collected and interpreted can use the free GCSE Statistics revision hub alongside this article.
What the 2025 national data shows
The latest complete figures available are the Joint Council for Qualifications provisional results for summer 2025. The table below uses the England GCSE Business Studies figures split by sex. JCQ reports the categories as male and female, so this article uses the search term “gender gap” while preserving the official data terminology when describing the results.
| Measure | Male candidates | Female candidates | Female-minus-male gap |
|---|---|---|---|
| Number of entries | 78,53478{,}53478,534 | 50,45450{,}45450,454 | Not an attainment measure |
| Grade 999 | 3.2%3.2\%3.2% | 5.0%5.0\%5.0% | 1.81.81.8 percentage points |
| Grades 777 to 999 | 17.5%17.5\%17.5% | 22.2%22.2\%22.2% | 4.74.74.7 percentage points |
| Grades 444 to 999 | 64.7%64.7\%64.7% | 67.5%67.5\%67.5% | 2.82.82.8 percentage points |
The direct answer, then, is yes: there was a measurable difference in GCSE Business outcomes in England in 2025, with female candidates achieving higher proportions at these thresholds.
But “female candidates did better” is still an incomplete summary. It does not mean every female candidate outperformed every male candidate. Nor does it identify a cause. The table reports aggregate outcomes across thousands of entries; it does not include prior attainment, school context, teaching, attendance, subject motivation or revision behaviour.
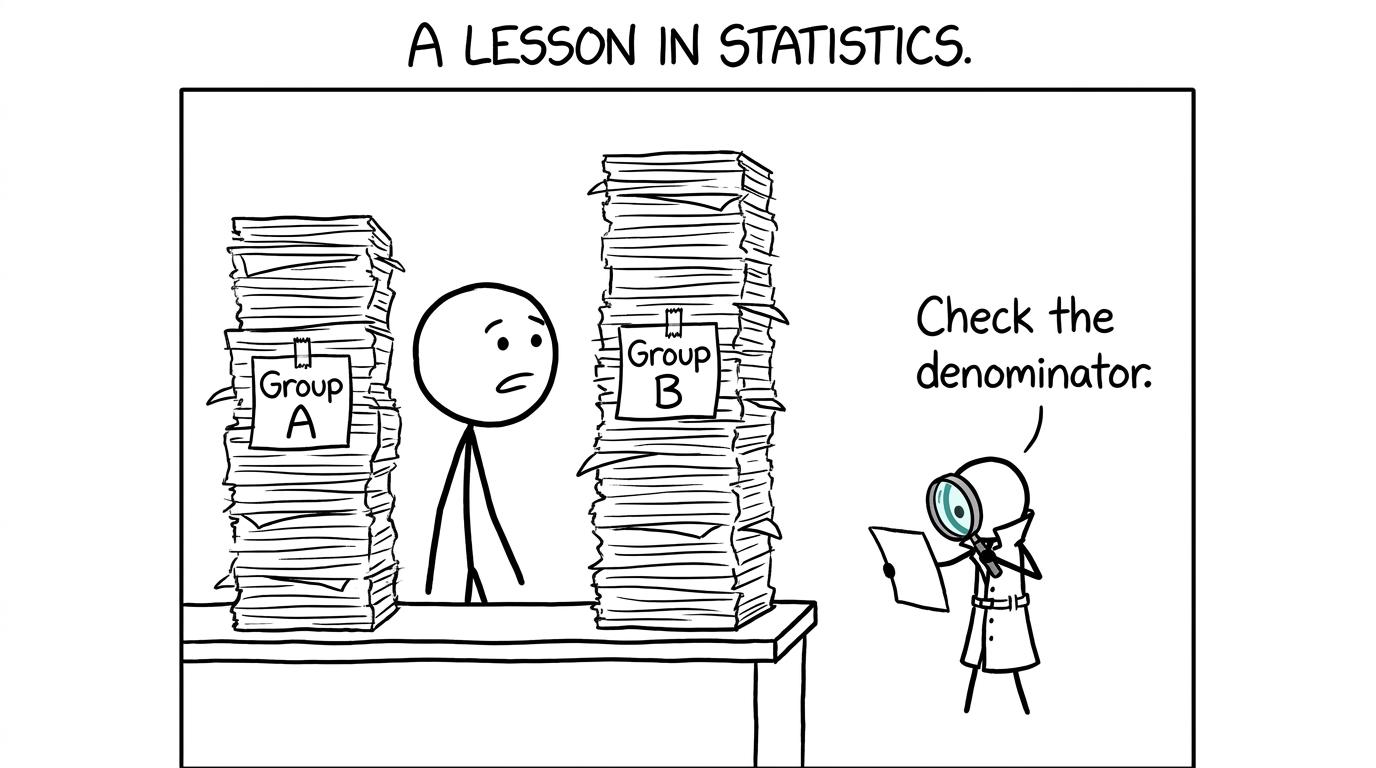 A statistics detective reminds students to check the denominator
Participation and attainment are not the same thing
The most striking entry pattern points in the other direction. There were 78,53478{,}53478,534 male entries and 50,45450{,}45450,454 female entries in the England table. Of the combined male and female entries, the approximate shares were:
Male share=78,534128,988×100≈60.9%\text{Male share}=\frac{78{,}534}{128{,}988}\times 100\approx 60.9\%Male share=128,98878,534×100≈60.9% Female share=50,454128,988×100≈39.1%\text{Female share}=\frac{50{,}454}{128{,}988}\times 100\approx 39.1\%Female share=128,98850,454×100≈39.1%These calculations tell us who entered the subject, not who attained a particular grade. A larger group can have a lower attainment percentage while still containing many successful candidates. This is why raw frequencies and percentages must not be treated as interchangeable.
The UK-wide JCQ headline recorded 137,924137{,}924137,924 GCSE Business Studies entries in 2025, an increase of 2.1%2.1\%2.1% from 2024. However, England, Wales and Northern Ireland have different qualification contexts and published subject tables. The clearest like-for-like attainment comparison here therefore uses the separate England figures rather than blending systems together.
This kind of denominator awareness is central to GCSE data questions. MathsGenie's statistical skills revision guide covers percentages, averages, spread, graphs and misleading conclusions in one place.
Has the GCSE Business results gap changed?
A single year is a snapshot. Comparing 2025 with 2024 gives limited but useful context.
At grades 777 to 999, the gap reduced from approximately 5.25.25.2 percentage points in 2024 to 4.74.74.7 percentage points in 2025. At grades 444 to 999, it reduced from about 3.33.33.3 to 2.82.82.8 percentage points.
That narrowing deserves careful wording. It did not occur because every outcome improved. The male grade 777-and-above rate rose slightly, while the female rate fell slightly. At grade 444 and above, both rates fell, but the female rate fell by more. A smaller gap can therefore emerge through several different movements.
Across all GCSE subjects in England, Ofqual also reported that the overall difference between boys' and girls' attainment narrowed slightly in 2025. Business followed that broad direction at the main thresholds, although its subject-specific rates and entry pattern remained distinct.
Two years are not enough to establish a lasting trend. Longer-term comparisons, consistent definitions and several examination series are needed before making strong claims about direction.
How to read a results gap mathematically
A percentage-point gap compares two percentages directly:
Percentage-point gap=female attainment rate−male attainment rate\text{Percentage-point gap}=\text{female attainment rate}-\text{male attainment rate}Percentage-point gap=female attainment rate−male attainment rateThis is different from percentage change, which compares a difference with an original value:
Percentage change=new value−original valueoriginal value×100\text{Percentage change}=\frac{\text{new value}-\text{original value}}{\text{original value}}\times 100Percentage change=original valuenew value−original value×100Confusing those ideas can exaggerate a headline. If two attainment rates differ by 4.74.74.7 percentage points, describing the difference simply as “4.7%4.7\%4.7%” is ambiguous. Percentage points make clear that two percentages are being subtracted.
You should also ask:
- Are the figures percentages or candidate numbers?
- Is the threshold grade 444, grade 777 or grade 999?
- Does the table cover England or the whole UK?
- Are all ages included, or only candidates aged 161616?
- Are the results provisional or final?
- Does the evidence show association, or is someone claiming causation?
These habits transfer directly to graphs and statistics questions. The Edexcel GCSE Statistics resources include lessons, worksheets, questions and papers for practising them.
 Students choose evidence rather than a dramatic headline
What the figures cannot tell us
National results can describe a pattern accurately without explaining it. From this table alone, we cannot conclude that the difference was caused by natural ability, revision time, examination technique, teaching or any other single factor.
We also cannot assume that the candidates were otherwise comparable. GCSE Business is generally an optional subject, and subject choice may vary between schools and groups. The male and female entry totals are unequal, and aggregate data does not reveal the full distribution of prior attainment or local circumstances.
Correlation is not causation. Students can strengthen that idea through scatter graph exam questions, where a visible relationship still requires cautious interpretation.
Most importantly, national averages do not set a ceiling for you. Your paper is marked against the assessment criteria and mark scheme, not against the average outcome of your demographic group.
Why this matters for maths revision
Business examinations contain quantitative work as well as written analysis. Current GCSE Business specifications from boards including AQA, Edexcel, OCR and Eduqas require students to calculate and interpret business data. Depending on the specification, this includes percentages, averages, revenue, costs, profit, cash flow, financial ratios and information presented in charts.
OCR and Eduqas, for example, specify that at least 10%10\%10% of the qualification's marks assess quantitative skills. Students must apply those skills in a business context rather than perform isolated calculations. Always check your own exam board's current specification for its exact requirements.
That makes maths revision practical Business preparation. Useful priorities include:
- fractions, decimals and percentages;
- percentage increase, decrease and change;
- ratios and averages;
- interpreting tables, bar charts and line graphs;
- identifying misleading scales or unsupported conclusions;
- showing calculations clearly and using suitable units.
MathsGenie's guide to GCSE Maths topics by exam board and tier can help you locate these skills within Edexcel, AQA, OCR and Eduqas Maths. For Business-specific preparation, the Eduqas GCSE Business revision hub brings the subject content and assessment structure together.
 A student uses practice as a shield against familiar exam topics
Common mistakes when interpreting results data
Treating a group average as an individual prediction
A national pattern says nothing certain about one student's result. Preparation, knowledge and exam execution remain more useful personal indicators.
Confusing entry numbers with attainment rates
More male candidates entered GCSE Business, but female candidates had higher attainment percentages at the key thresholds. Both statements can be true simultaneously.
Confusing percentages with percentage points
Subtracting two attainment rates produces a percentage-point difference. Percentage change requires division by the original value.
Comparing incompatible populations
England-only figures should not be silently compared with UK totals. Results for all candidates may also differ from results restricted to 161616-year-olds.
Inventing a cause from descriptive data
The table records an association between the reported sex category and outcomes. It does not demonstrate why that association exists.
Ignoring the year and grade threshold
The gap depends on the examination series and the threshold selected. A grade 999 comparison does not answer the same question as a grade 444 comparison.
Turn the headline into useful revision
The calmest conclusion is also the most useful. The 2025 data shows a GCSE Business attainment gap in favour of female candidates at the main thresholds, alongside substantially higher male participation. The attainment gap narrowed from 2024, but one annual change is not enough to prove a permanent trend.
For a student, the headline matters less than the habits used to examine it: check the population, read the denominator, distinguish percentages from percentage points and avoid claiming more than the evidence supports.
Build those habits with MathsGenie. Start with the best order for learning GCSE Maths topics, use revision lessons to repair weak methods, then move to practice questions, mini tests and past papers. Mark every attempt with the mark scheme, watch video solutions where needed, and use predicted papers only after building secure foundations. A revision planner can turn each weakness into a scheduled next step, and that is far more powerful than any national average.