GCSE Art and Design Gender Gap Results Explained
GCSE art and design gender gap results reveal a clear difference. Explore the 2025 national data, percentage-point gaps and what they really mean.
A national results table can feel strangely personal. You see one column labelled male, another labelled female, and it is tempting to ask what the figures predict about you. The short answer from the latest GCSE art and design gender gap results is clear: female candidates were more likely than male candidates to achieve both grade 444 and above and grade 777 and above in the UK in 202520252025. Female candidates also made up roughly two-thirds of entries.
But national averages describe groups, not individuals. They do not determine your grade, explain why the difference exists or prove that gender causes attainment. For a student preparing for GCSE maths, the data offers something more useful: a lesson in reading percentages carefully, questioning comparisons and refusing to confuse a pattern with a prediction.
The national picture at a glance
The Joint Council for Qualifications, usually called JCQ, publishes UK GCSE results by subject and sex. Its summer 202520252025 figures for Art and Design subjects show:
- Female candidates accounted for 66.8%66.8\%66.8% of entries, compared with 33.2%33.2\%33.2% for male candidates.
- At grade 777 and above, the outcomes were 29.5%29.5\%29.5% for female candidates and 13.2%13.2\%13.2% for male candidates.
- At grade 444 and above, the outcomes were 83.1%83.1\%83.1% for female candidates and 65.0%65.0\%65.0% for male candidates.
- Results improved for both groups compared with 202420242024, although male outcomes rose by more at the two reported thresholds.
Here is the central comparison:
| UK Art and Design measure, 202520252025 | Male candidates | Female candidates | Percentage-point gap |
|---|---|---|---|
| Share of subject entries | 33.2%33.2\%33.2% | 66.8%66.8\%66.8% | 33.633.633.6 points |
| Grade 777 and above | 13.2%13.2\%13.2% | 29.5%29.5\%29.5% | 16.316.316.3 points |
| Grade 444 and above | 65.0%65.0\%65.0% | 83.1%83.1\%83.1% | 18.118.118.1 points |
The reported entry counts were 68,51068{,}51068,510 male candidates and 138,088138{,}088138,088 female candidates, producing 206,598206{,}598206,598 entries overall. Art and Design subjects represented 3.4%3.4\%3.4% of all GCSE entries in the data.
A useful checklist when reading these results is:
- Check whether the figures cover England or the whole UK.
- Separate participation from attainment.
- Compare percentages rather than raw candidate totals.
- Measure differences in percentage points.
- Look at change over time as well as one results day.
- Treat association as evidence of a pattern, not proof of a cause.
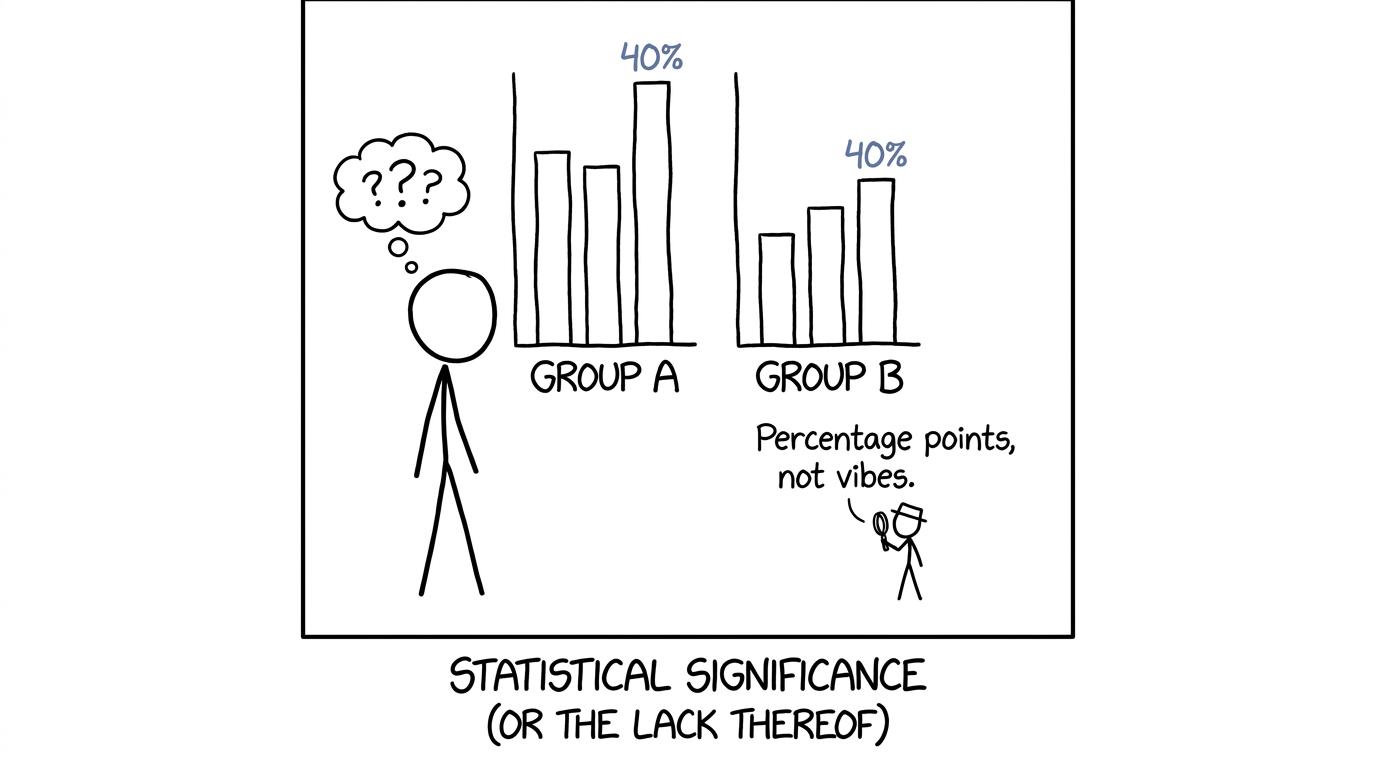 Stick-figure detectives investigate two bar charts and insist on percentage points rather than vibes
What the GCSE Art and Design gender gap results show
There are really two gaps here. The first concerns who takes the subject. The second concerns the grades awarded to those candidates.
The participation gap
There were just over twice as many female as male Art and Design entries in the UK data. The ratio is approximately:
138,088:68,510≈2.02:1138{,}088:68{,}510 \approx 2.02:1138,088:68,510≈2.02:1That matters because raw totals can be misleading. If more female candidates enter the subject, it is unsurprising that more female candidates receive any particular grade in absolute terms. To compare attainment fairly, we need the percentage within each group that reached a threshold.
Subject choice also affects the composition of each cohort. The candidates who select Art and Design are not a random sample of all male and female GCSE students. They may differ in interests, prior experience, school provision and many other measured or unmeasured ways. The national table cannot isolate those influences.
The attainment gap
Among candidates taking the subject, the female grade 777 or above rate exceeded the male rate by:
29.5%−13.2%=16.3 percentage points29.5\%-13.2\%=16.3\text{ percentage points}29.5%−13.2%=16.3 percentage pointsAt grade 444 or above, the difference was:
83.1%−65.0%=18.1 percentage points83.1\%-65.0\%=18.1\text{ percentage points}83.1%−65.0%=18.1 percentage pointsThese are substantial descriptive gaps. Saying so is not the same as claiming an explanation. Results tables tell us what happened within the recorded cohorts. On their own, they do not tell us why.
Did the gap narrow in 2025?
The answer depends on the threshold being examined. In the UK figures, the male grade 777 and above rate increased from 12.4%12.4\%12.4% in 202420242024 to 13.2%13.2\%13.2% in 202520252025, a rise of 0.80.80.8 percentage points. The female rate moved from 29.4%29.4\%29.4% to 29.5%29.5\%29.5%, a rise of 0.10.10.1 percentage points.
At grade 444 and above, male outcomes rose from 64.1%64.1\%64.1% to 65.0%65.0\%65.0%, while female outcomes rose from 82.7%82.7\%82.7% to 83.1%83.1\%83.1%. Those are increases of 0.90.90.9 and 0.40.40.4 percentage points respectively.
So the attainment difference narrowed slightly at both thresholds, even though the female outcomes remained considerably higher. Meanwhile, female candidates' share of Art and Design entries rose marginally from 66.7%66.7\%66.7% to 66.8%66.8\%66.8%. The participation gap therefore did not narrow.
This is why the phrase “the gender gap” can hide more than it reveals. There can be different gaps in entry, attainment and improvement over time. Each requires its own measure.
Why percentage points matter
A percentage-point change is the direct subtraction of two percentages. A percentage change measures the difference relative to the starting value. They answer different questions.
For example, moving from 12.4%12.4\%12.4% to 13.2%13.2\%13.2% is an increase of 0.80.80.8 percentage points. Describing it merely as a 0.8%0.8\%0.8% increase would be incorrect. The relative percentage increase is approximately:
13.2−12.412.4×100%≈6.5%\frac{13.2-12.4}{12.4}\times 100\% \approx 6.5\%12.413.2−12.4×100%≈6.5%This distinction appears frequently in GCSE maths questions involving statistics, financial change and interpreting charts. If it is a weak area, use the GCSE Maths revision hub to find revision lessons and practice questions for your board and tier. The full GCSE topic guide by exam board and tier can also help you locate the relevant number and statistics skills.
What the figures cannot prove
It would be easy to turn the table into a neat story: one group works in a certain way, therefore it receives different results. Real education data is rarely that simple.
National outcomes do not reveal, by themselves:
- how much time individual students spent developing their portfolios;
- differences in school resources, teaching or access to specialist materials;
- candidates' prior attainment or reasons for choosing the subject;
- differences between Fine Art, Photography, Textiles, Graphic Communication and other titles;
- how several factors may interact for particular groups of students;
- whether gender itself caused the observed differences.
The published categories are also those used in the results data, usually male and female or boys and girls. They do not capture every student's experience of gender. That is another reason to describe the dataset precisely rather than make assumptions about individuals.
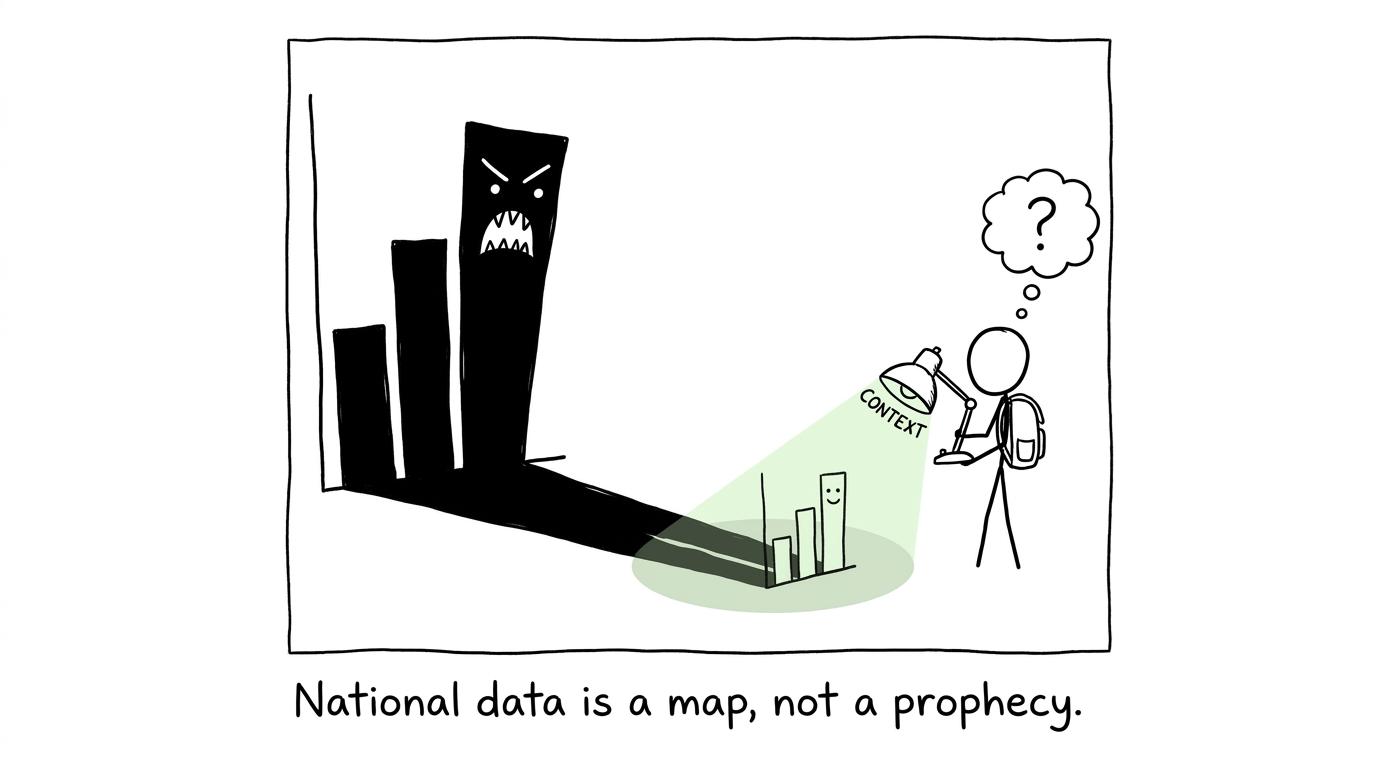 A giant chart becomes less frightening when a student shines a lamp labelled context on it
How Art and Design assessment affects interpretation
GCSE Art and Design is not assessed like GCSE maths. Across the regulated specifications, work is judged through four assessment objectives covering the development of ideas, refinement through materials and techniques, recording of observations and presentation of a personal response. Each objective is equally weighted.
Specifications from boards including AQA, Edexcel, OCR and Eduqas use portfolio work and an externally set assignment, although students should always check the exact requirements and dates for their board. This extended assessment structure means that planning, documentation, experimentation and sustained project development all matter.
That observation still does not explain the gender gap. It simply tells us that the final result reflects a body of work assessed against shared criteria, rather than one short written paper. Any convincing explanation would need research designed to test possible influences while accounting for prior attainment, subject choice, school context and other relevant variables.
What maths students can learn from the data
The most valuable response is not to memorise the table. It is to practise the habits behind sound statistical reasoning.
Ask what the denominator is
The 29.5%29.5\%29.5% figure means the proportion of female Art and Design candidates who achieved grade 777 or above. It does not mean that 29.5%29.5\%29.5% of all female GCSE students achieved that result, nor that female candidates received 29.5%29.5\%29.5% of the available top grades.
Distinguish a sample from a population
The table covers candidates receiving results in that examination series. It is strong evidence about those entries, but it does not automatically describe every young person, every school or future examination cohorts.
Compare like with like
UK and England-only totals are not interchangeable. Neither are all-age results and figures restricted to 161616-year-olds. Before comparing two percentages, check that the subject grouping, location, age group, year and grade threshold match.
Use data to guide action, not identity
A group average is not a ceiling or a forecast. The same principle applies to a mock result. Your mark is evidence about performance on one set of questions; it is not a permanent label.
A practical maths response is to use short GCSE mini tests to collect evidence, identify patterns and then repair them. MathsGenie's guide to finding your weakest GCSE topics explains how to turn lost marks into a focused revision list.
Balancing Art coursework with maths revision
Art projects can expand to fill every available evening. Maths revision can do the same. A realistic plan gives each subject a defined space instead of relying on whichever deadline feels loudest.
Use short, specific maths sessions: one revision lesson, a focused set of practice questions, immediate marking and a brief correction. The best order for learning GCSE maths topics provides a sensible sequence, while the one-month GCSE maths revision plan offers a structure for the final run-in.
Save longer sessions for timed papers and portfolio work requiring sustained concentration. This reduces task switching and makes progress visible in both subjects.
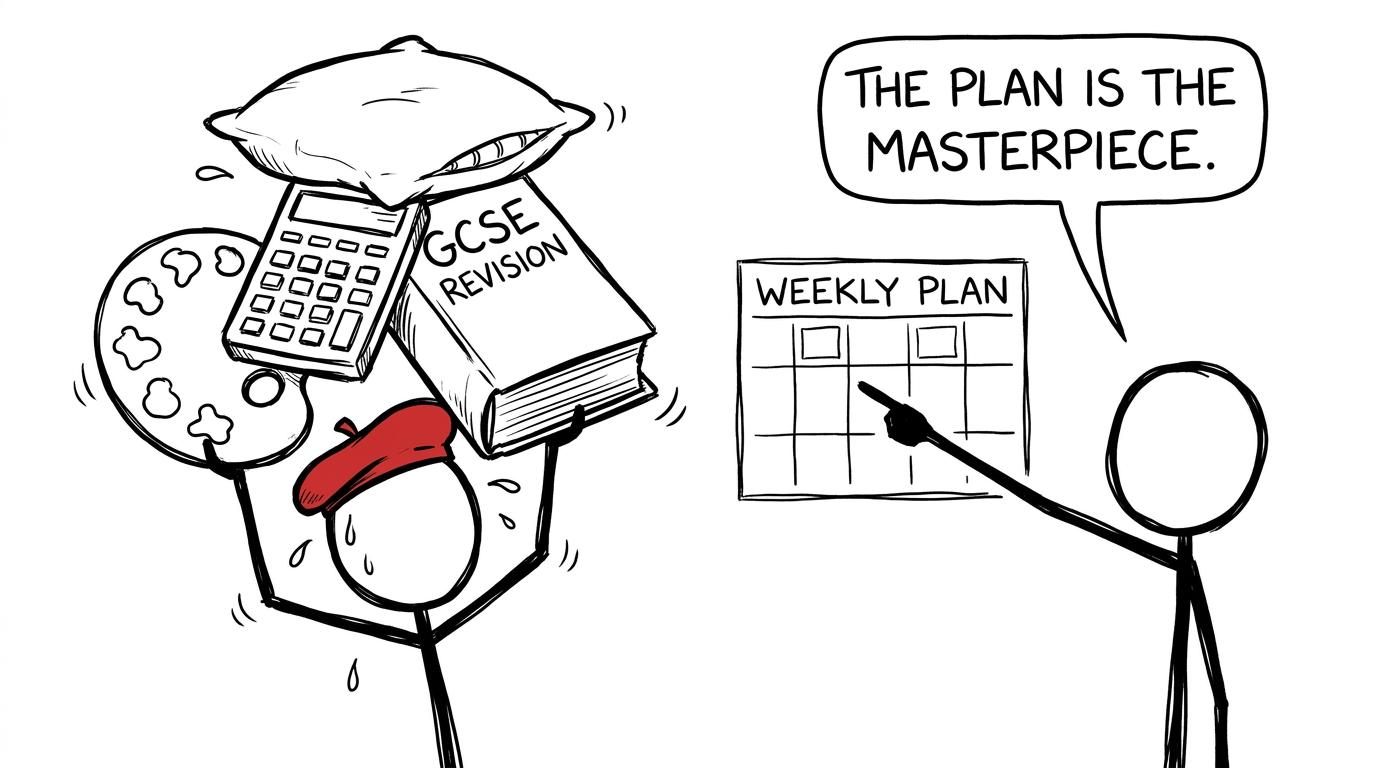 A stick-figure student balances art materials, a calculator and sleep while another points to a calm timetable
Common mistakes when interpreting gender results
Confusing percentage points with percentages. A movement from 20%20\%20% to 25%25\%25% is a rise of 555 percentage points, but a relative increase of 25%25\%25%.
Comparing raw totals alone. Candidate counts are strongly affected by the participation gap. Attainment rates within each group provide a more meaningful grade comparison.
Assuming correlation proves causation. The table identifies an association between recorded sex and outcomes. It does not establish a causal mechanism.
Treating every Art and Design course as identical. National subject totals can combine different titles and candidates from different parts of the UK.
Turning averages into stereotypes. Neither a male nor a female candidate is destined to receive a particular grade. Individual work is assessed against the relevant criteria.
Ignoring the year and coverage. Always label data as UK or England-only and state the examination year. Mixing datasets can produce a comparison that looks precise but means very little.
The result is a starting point, not a verdict
The 202520252025 national data shows a clear gender difference in GCSE Art and Design participation and attainment. Female candidates formed about two-thirds of entries and had higher rates at grade 444 and grade 777 thresholds. Male outcomes improved more between 202420242024 and 202520252025, so the attainment gaps narrowed slightly, but they remained sizeable.
Read that conclusion with care. The figures describe cohorts; they do not explain causes or predict an individual's grade. That is the quiet power of statistical literacy: seeing a real pattern without asking it to say more than the evidence allows.
Apply the same discipline to your maths revision. Start with the MathsGenie GCSE revision area, learn through free revision lessons, practise with targeted questions and mini tests, and then test your progress using past papers, predicted papers, mark schemes and video solutions. For a clear paper strategy, read when to start GCSE past papers. Let evidence guide your next step; never define your limit.