Feeling Behind GCSE Statistics? A Calm Catch-Up Plan
Feeling behind GCSE Statistics? Learn why it is common, diagnose your gaps and use a calm revision plan to rebuild confidence steadily before your exams.
The unsettling part of revision is not always the topic itself. Sometimes it is hearing somebody say that histograms are “easy”, watching a friend finish a question quickly, or opening a past paper and recognising less than you expected.
If you are feeling behind GCSE Statistics, the short answer is yes: that feeling is normal, and it does not prove that you cannot catch up. Students see other people's confident answers, not the gaps in their knowledge. Statistics can also feel unusually fragmented because it combines calculations, graphs, written interpretation and decisions about data.
The solution is not to panic-revise the entire course. It is to identify the exact skills costing you marks, rebuild them in a sensible order and test them through questions. That turns “I am behind” from a judgement into a list of manageable tasks.
Your calm catch-up checklist
Start here rather than building an enormous timetable:
- Confirm whether you mean statistics within GCSE Maths or the separate GCSE Statistics qualification.
- Check your exam board, specification and tier.
- Attempt a short selection of questions without notes.
- Label each gap by topic and by type of error.
- Repair one small skill at a time.
- Mark your work immediately and correct every lost mark.
- Revisit the same skill within a few days.
- Move towards mixed and timed practice gradually.
- Protect sleep, breaks and time away from revision.
The MathsGenie GCSE Statistics revision hub is a practical starting point because it brings relevant resources together by exam board.
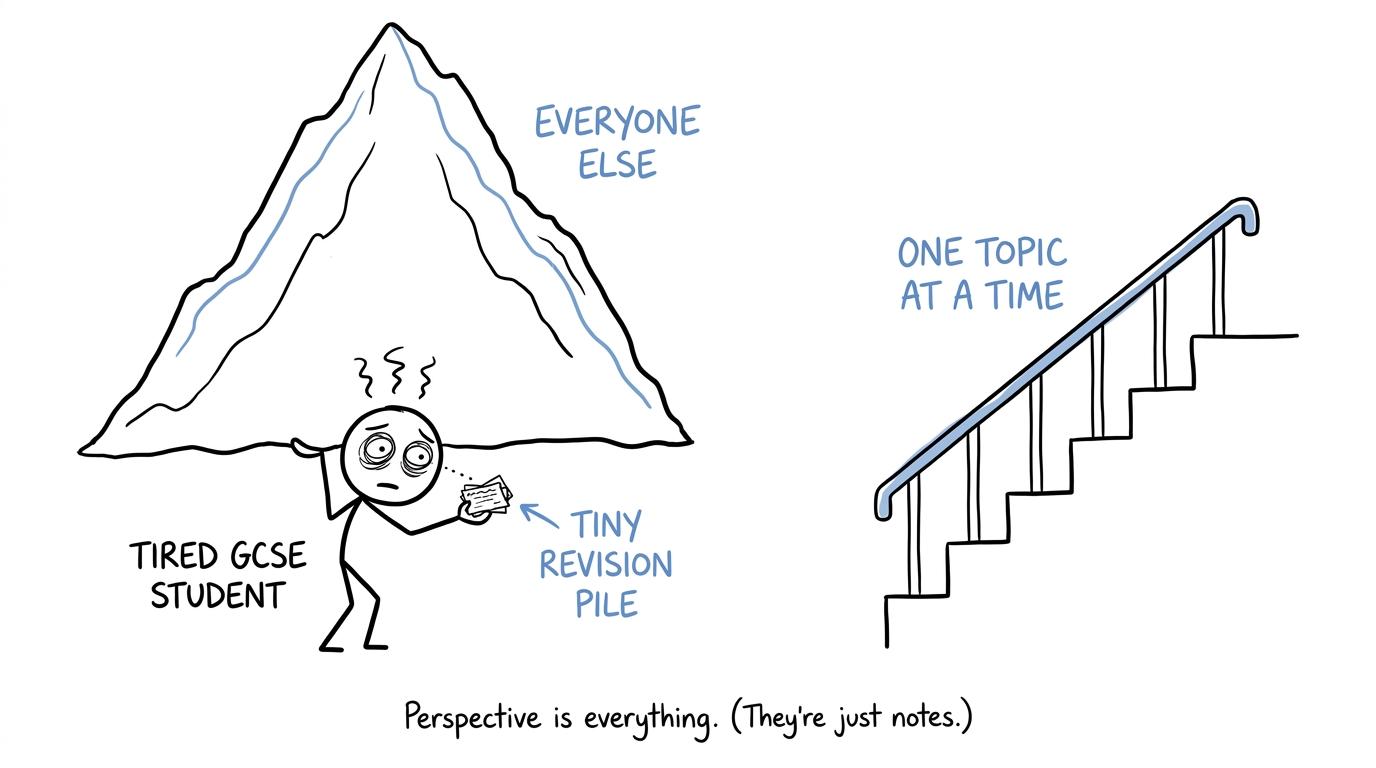 A student discovers that the mountain called everyone else is really a small pile of notes viewed too closely
Why feeling behind GCSE Statistics is so convincing
Comparison gives you incomplete data. You might notice that another student remembers the frequency-density formula, but not that they struggle to evaluate a sampling method. You hear the correct answer somebody gives in class, but not the uncertain thoughts that came before it.
Statistics adds another difficulty: one weak foundation can appear in several different forms. If grouped data is unclear, you may struggle with estimated means, cumulative frequency diagrams and histograms. That can look like three separate failures when it may really be one connected gap.
There is also a difference between recognition and recall. A revision page can seem familiar while you are reading it. In an exam, however, you must choose the method without being prompted. Discovering that difference during practice can feel like falling backwards. It is actually useful evidence about what to revise next.
Current NHS exam-stress guidance recognises that nervousness around exams is normal. It recommends practical support, realistic revision planning, sufficient sleep and practising the activities required in the real exam. If stress is persistent, severe or interfering with everyday life, speak to a trusted adult, teacher, pastoral lead or GP. Revision advice is not a substitute for wellbeing support.
First, check which course you are taking
Statistics appears inside GCSE Maths specifications for boards including Edexcel, AQA, OCR and Eduqas. That content includes ideas such as sampling, averages, measures of spread, charts, scatter graphs and interpreting distributions. Some topics are restricted by tier or specification.
The separate GCSE Statistics qualification goes further. It may include a broader statistical enquiry process, more detailed data collection and evaluation, additional representations and probability content. Its exact assessment structure depends on your board.
This distinction matters. Revising material outside your course can make you feel behind for no good reason. Check the specification supplied by your school and use resources matched to it. Edexcel students taking the separate qualification can begin with the Edexcel GCSE Statistics revision page, which includes Foundation and Higher resources.
Diagnose the gap before trying to close it
A low mark is not a diagnosis. It tells you that marks were lost, but not why.
Attempt a short paper section or a mixed set of questions without notes. Then sort every lost mark into one of these categories:
- Knowledge: you did not know the definition, fact or formula.
- Method: you knew the topic but could not organise the steps.
- Representation: you misread a table, scale, class interval or graph.
- Interpretation: your calculation was possible, but your conclusion was vague or unsupported.
- Accuracy: arithmetic, calculator use, rounding or plotting caused the error.
- Exam technique: you missed a command word, unit or required comparison.
This gives you a marks-leak list. “Bad at statistics” is too large to act upon. “I use bar height instead of bar area in histograms” is precise enough to fix.
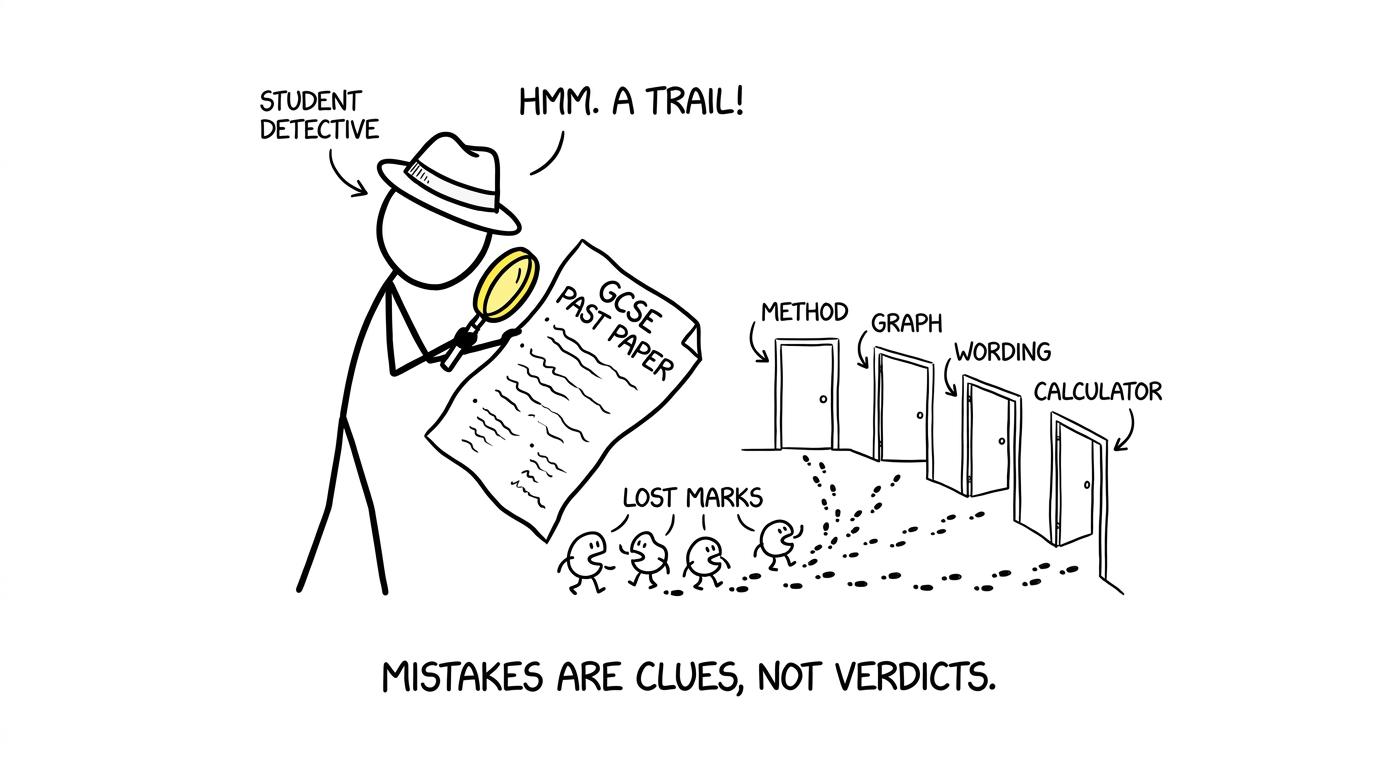 A student detective follows the footprints of lost marks towards different error categories
Rebuild GCSE Statistics in connected layers
You do not need to follow your textbook from its first page. Start with ideas that unlock several later topics.
Data language and collection
Secure the difference between qualitative and quantitative data, discrete and continuous data, populations and samples, and primary and secondary data. Learn to identify bias and explain why a sampling method may not represent the intended population.
These questions often need precise language rather than long answers. Read the context and explain the specific consequence of the problem. “The sample is biased” is weaker than identifying which group is overrepresented and how that could affect the conclusion.
Averages, frequency and spread
Next, rebuild mean, median, mode, range and grouped frequency tables. For an exact frequency distribution, the mean is
xˉ=∑fx∑f.\bar{x}=\frac{\sum fx}{\sum f}.xˉ=∑f∑fx.When class midpoints represent grouped intervals, the resulting mean is an estimate. The averages from frequency tables revision guide can help you separate exact and estimated calculations.
Measures of spread describe variation rather than the typical value. For quartiles, the interquartile range is
IQR=Q3−Q1.\operatorname{IQR}=Q_3-Q_1.IQR=Q3−Q1.When comparing distributions, discuss both location and spread in context. One statement about the median and another about the interquartile range or range is usually more informative than saying one group is simply “better”.
Graphs and representations
Then connect each graph to the kind of data it represents. Bar charts suit separate categories or discrete values; histogram bars represent grouped continuous data and touch one another. In a histogram, frequency is represented by area, with
frequency density=frequencyclass width.\text{frequency density}=\frac{\text{frequency}}{\text{class width}}.frequency density=class widthfrequency.Use the histograms revision guide if unequal class widths are a weak point.
Cumulative frequency is a running total. Its graphs can be used to estimate the median and quartiles. The cumulative frequency revision guide explains the links between upper class boundaries, cumulative totals and measures of spread.
Scatter graphs deal with paired data. You should recognise the direction of correlation, draw a sensible line of best fit and understand the limits of prediction. Correlation does not by itself establish causation. Review these decisions through the scatter graphs revision guide.
Use a revision loop instead of a revision marathon
Catching up is less about producing heroic days and more about creating a loop you can repeat:
- Choose one precise topic.
- Review a short revision lesson or guide.
- Close the notes and recall the method.
- Answer a manageable set of exam-style questions.
- Mark them using the mark scheme or video solution.
- Write one sentence explaining each error.
- Retry the skill without support.
- Schedule a brief retest a few days later.
A session can be productive without being long. The important feature is feedback. Reading for an hour may feel comfortable, but a smaller amount of marked practice reveals much more.
Use the MathsGenie revision planner to give each session a specific task. Write “cumulative frequency questions and corrections”, not merely “revise statistics”. If your wider GCSE workload also feels unmanageable, the GCSE catch-up revision guide offers a structured approach across subjects.
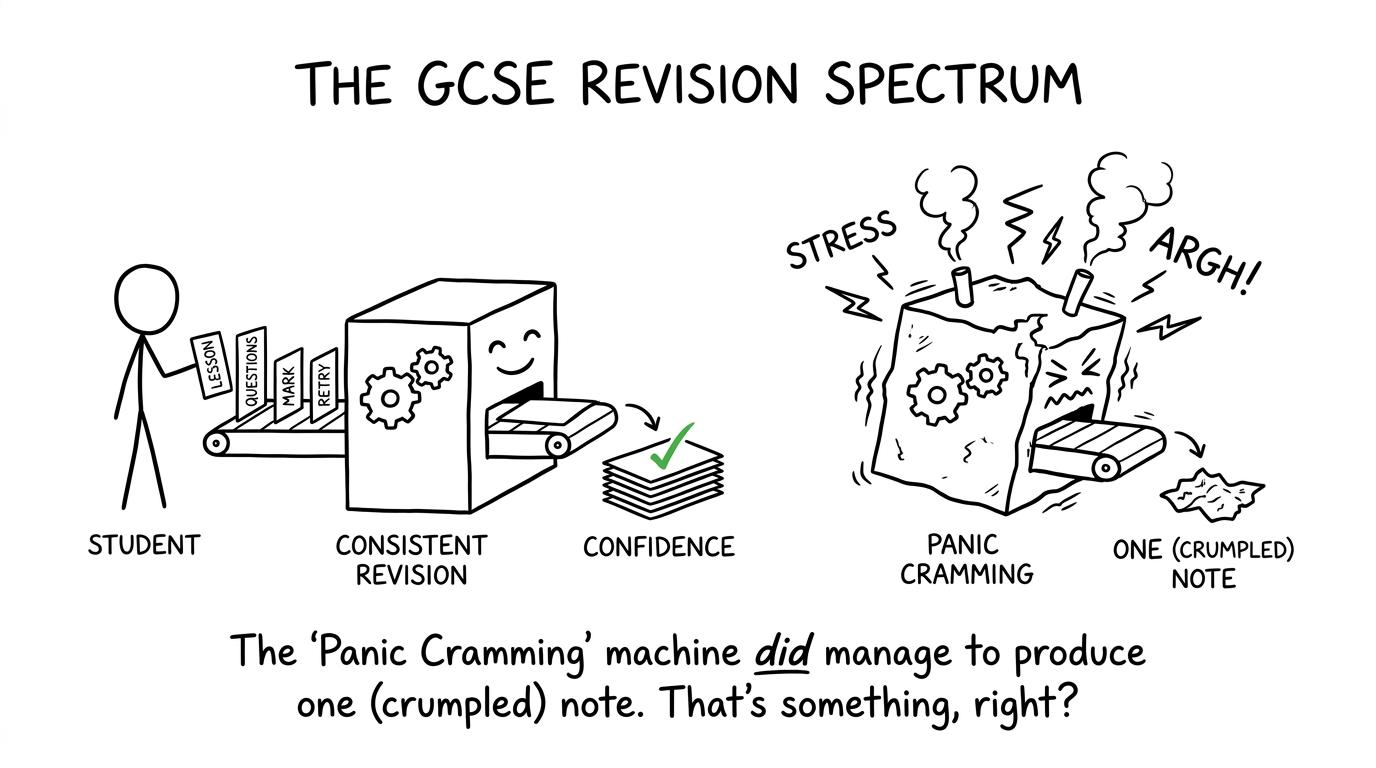 A calm revision machine produces confidence while a panic-cramming machine fills the room with smoke
When to start using past papers
Past papers are valuable before you feel ready, but they should not dominate every session.
At first, use short sections diagnostically. Untimed practice is reasonable while you are rebuilding methods. Once individual topics become more secure, mix them so that you must decide which technique applies. Then introduce timed sections and, finally, full papers under the conditions used by your qualification.
Mark schemes matter as much as the paper. They show where method marks are available and what an interpretation must communicate. Record raw marks to measure your own progress, but do not treat one paper as a prediction of your final grade. Different papers vary in difficulty, and official grade boundaries are set for particular exam series.
Predicted papers can provide fresh practice nearer the exam, but they cannot guarantee which topics will appear. Use them after topic repair, alongside official past papers rather than instead of them.
Common mistakes that make the gap feel larger
Revising everything at once
A broad target such as “learn statistics” creates motion without direction. Reduce it to one observable skill, such as identifying a biased sample or interpreting a box plot.
Copying methods without retrieving them
Notes can make a method look familiar. Close the page and explain the method from memory before attempting questions.
Ignoring written interpretation
Statistics is not only calculation. Practise making comparisons in context, identifying limitations and distinguishing correlation from causation.
Treating every error as missing knowledge
Some lost marks come from scales, units, calculator entry or vague wording. Categorising errors prevents you from relearning content you already understand.
Using the wrong tier or qualification resources
A Higher-only topic or separate GCSE Statistics technique may not belong to your course. Match revision to your board, tier and current specification.
Sacrificing sleep to catch up
Late-night cramming can make tomorrow's concentration worse. A realistic plan with breaks and sleep is not a soft option; it is part of effective preparation.
You do not need to catch everyone else
There is no reliable way to know where “everyone else” really is. More importantly, their position does not tell you your next action.
Your useful comparison is smaller: the question you could not begin last week, the graph you can interpret today, and the mistake you no longer repeat. Progress in statistics often feels slow until several connected ideas begin working together. Then tables, graphs and calculations stop looking like separate obstacles and start looking like different views of the same data.
Begin at the MathsGenie GCSE Statistics hub. Choose your board and tier, rebuild weak topics with free revision lessons and guides, practise with worksheets and exam questions, and then test yourself using past papers, mark schemes, video solutions, mini tests and predicted papers where available. Do not wait to feel completely confident. Start with one identified gap, correct it carefully, and let the evidence of improvement create the confidence.