Figure 1 shows how atmospheric pressure changes with altitude (height above the surface) on Saturn's moon, Titan.
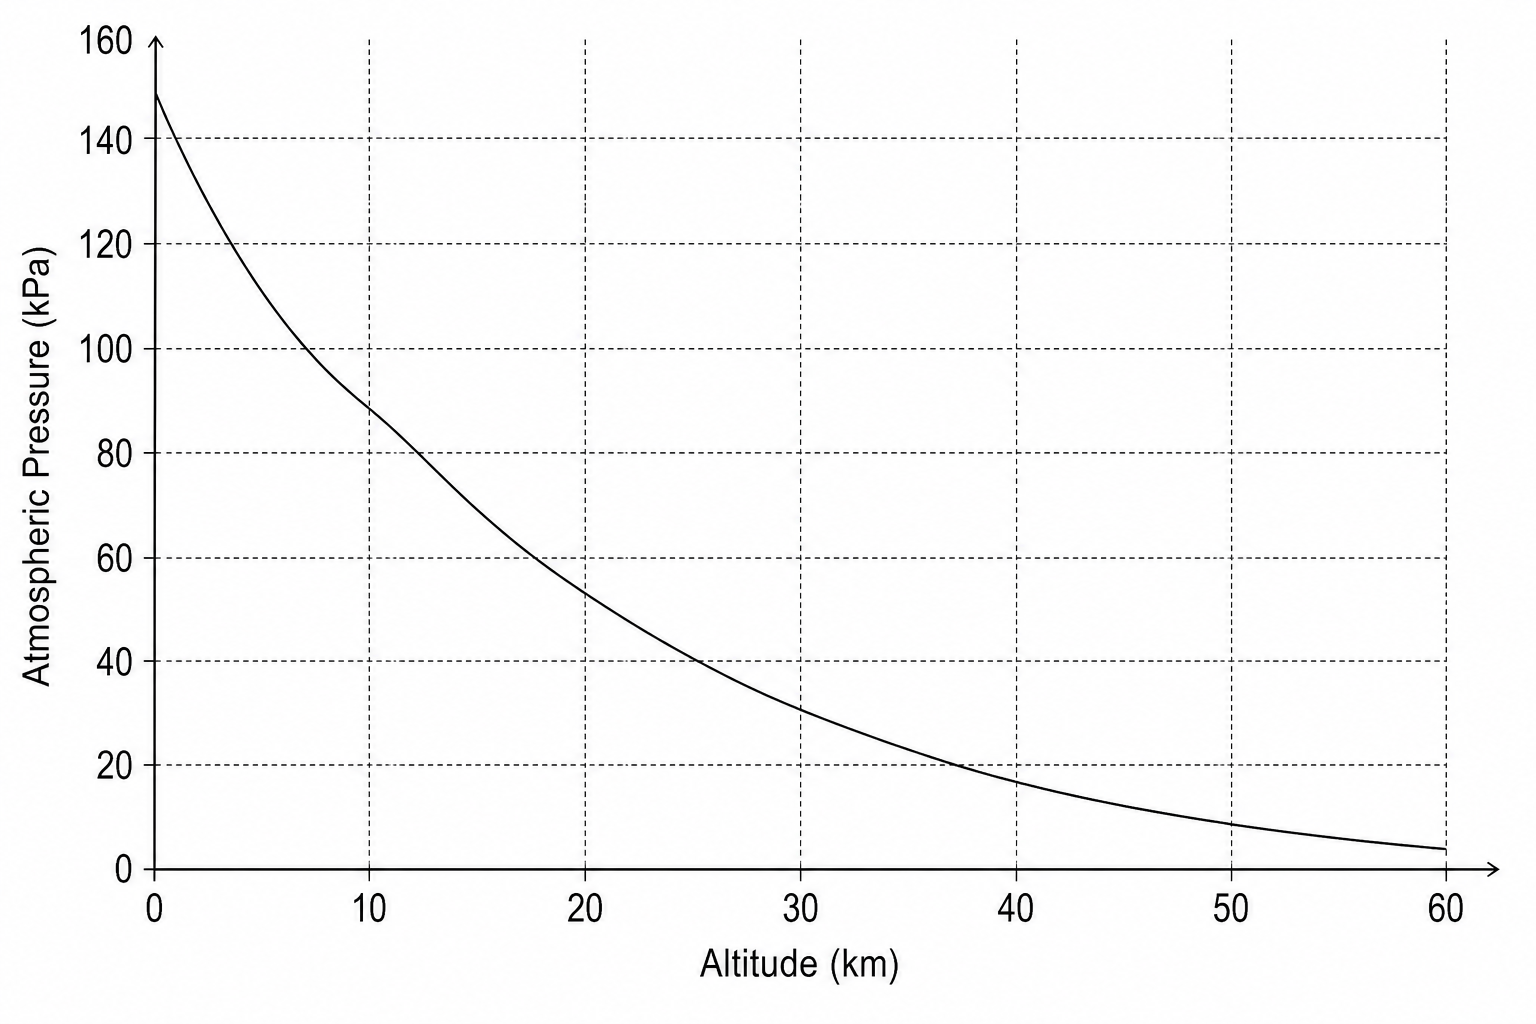
The data plotted in Figure 1 is shown in the table below:
| Altitude (km) | Atmospheric Pressure (kPa) |
|---|---|
| 0 | 147 |
| 10 | 91 |
| 20 | 54 |
| 30 | 31 |
| 40 | 17 |
| 50 | 9 |
| 60 | 4 |
Using the data, describe how atmospheric pressure changes with altitude.