Pressure in fluids and upthrust

EasyMediumHard
123456789101112131415161718192021222324252627282930313233343536373839404142434445464748495051525354555657585960616263646566676869707172737475767778798081
Question 70
Easy

A student researches how atmospheric pressure varies with altitude above sea level and plots their findings on a graph.
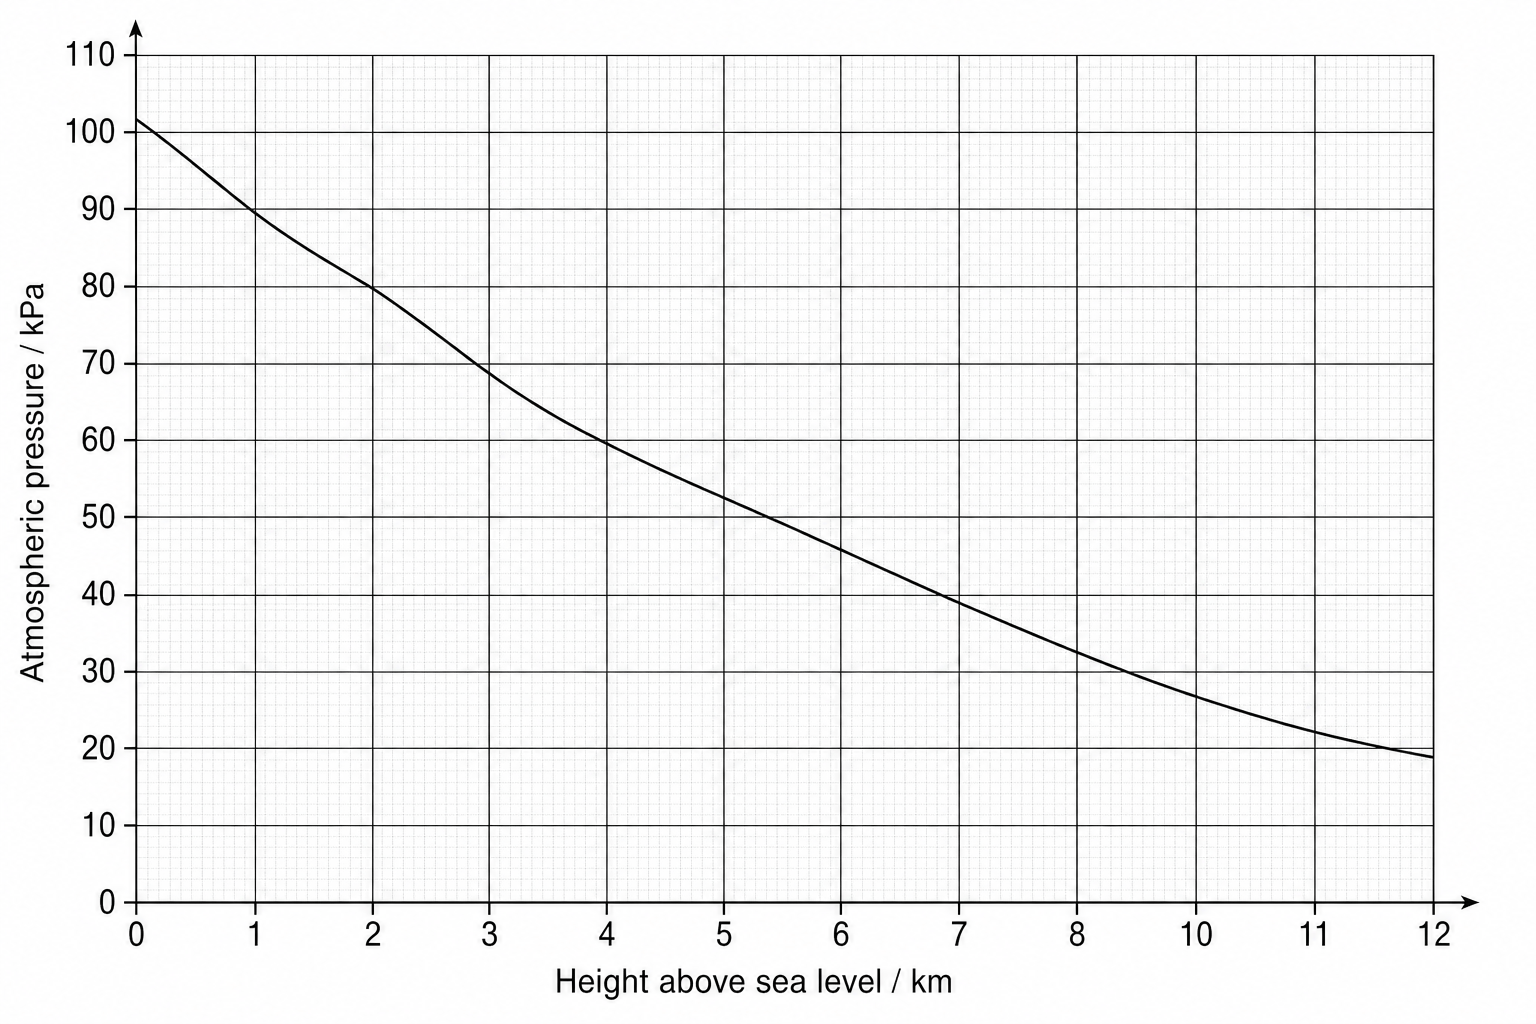
A line graph showing how atmospheric pressure changes with height above sea level. The vertical axis is labeled 'Atmospheric pressure in kPa' and ranges from 0 to 110 with major grid lines every 10 kPa. The horizontal axis is labeled 'Height above sea level in km' and ranges from 0 to 12 with major grid lines every 1 km. A smooth, decreasing curve starts at (0, 101) and passes through the coordinates (2, 80), (4, 62), (5, 54), (6, 47), (8, 36), (10, 26), and (12, 19).

Use the graph to estimate the atmospheric pressure at a height of 5 km above sea level.

[1]

Pressure in fluids and upthrust Questions

  1. GCSE
  2. /Physics
  3. /Pressure in fluids and upthrust