Question 6
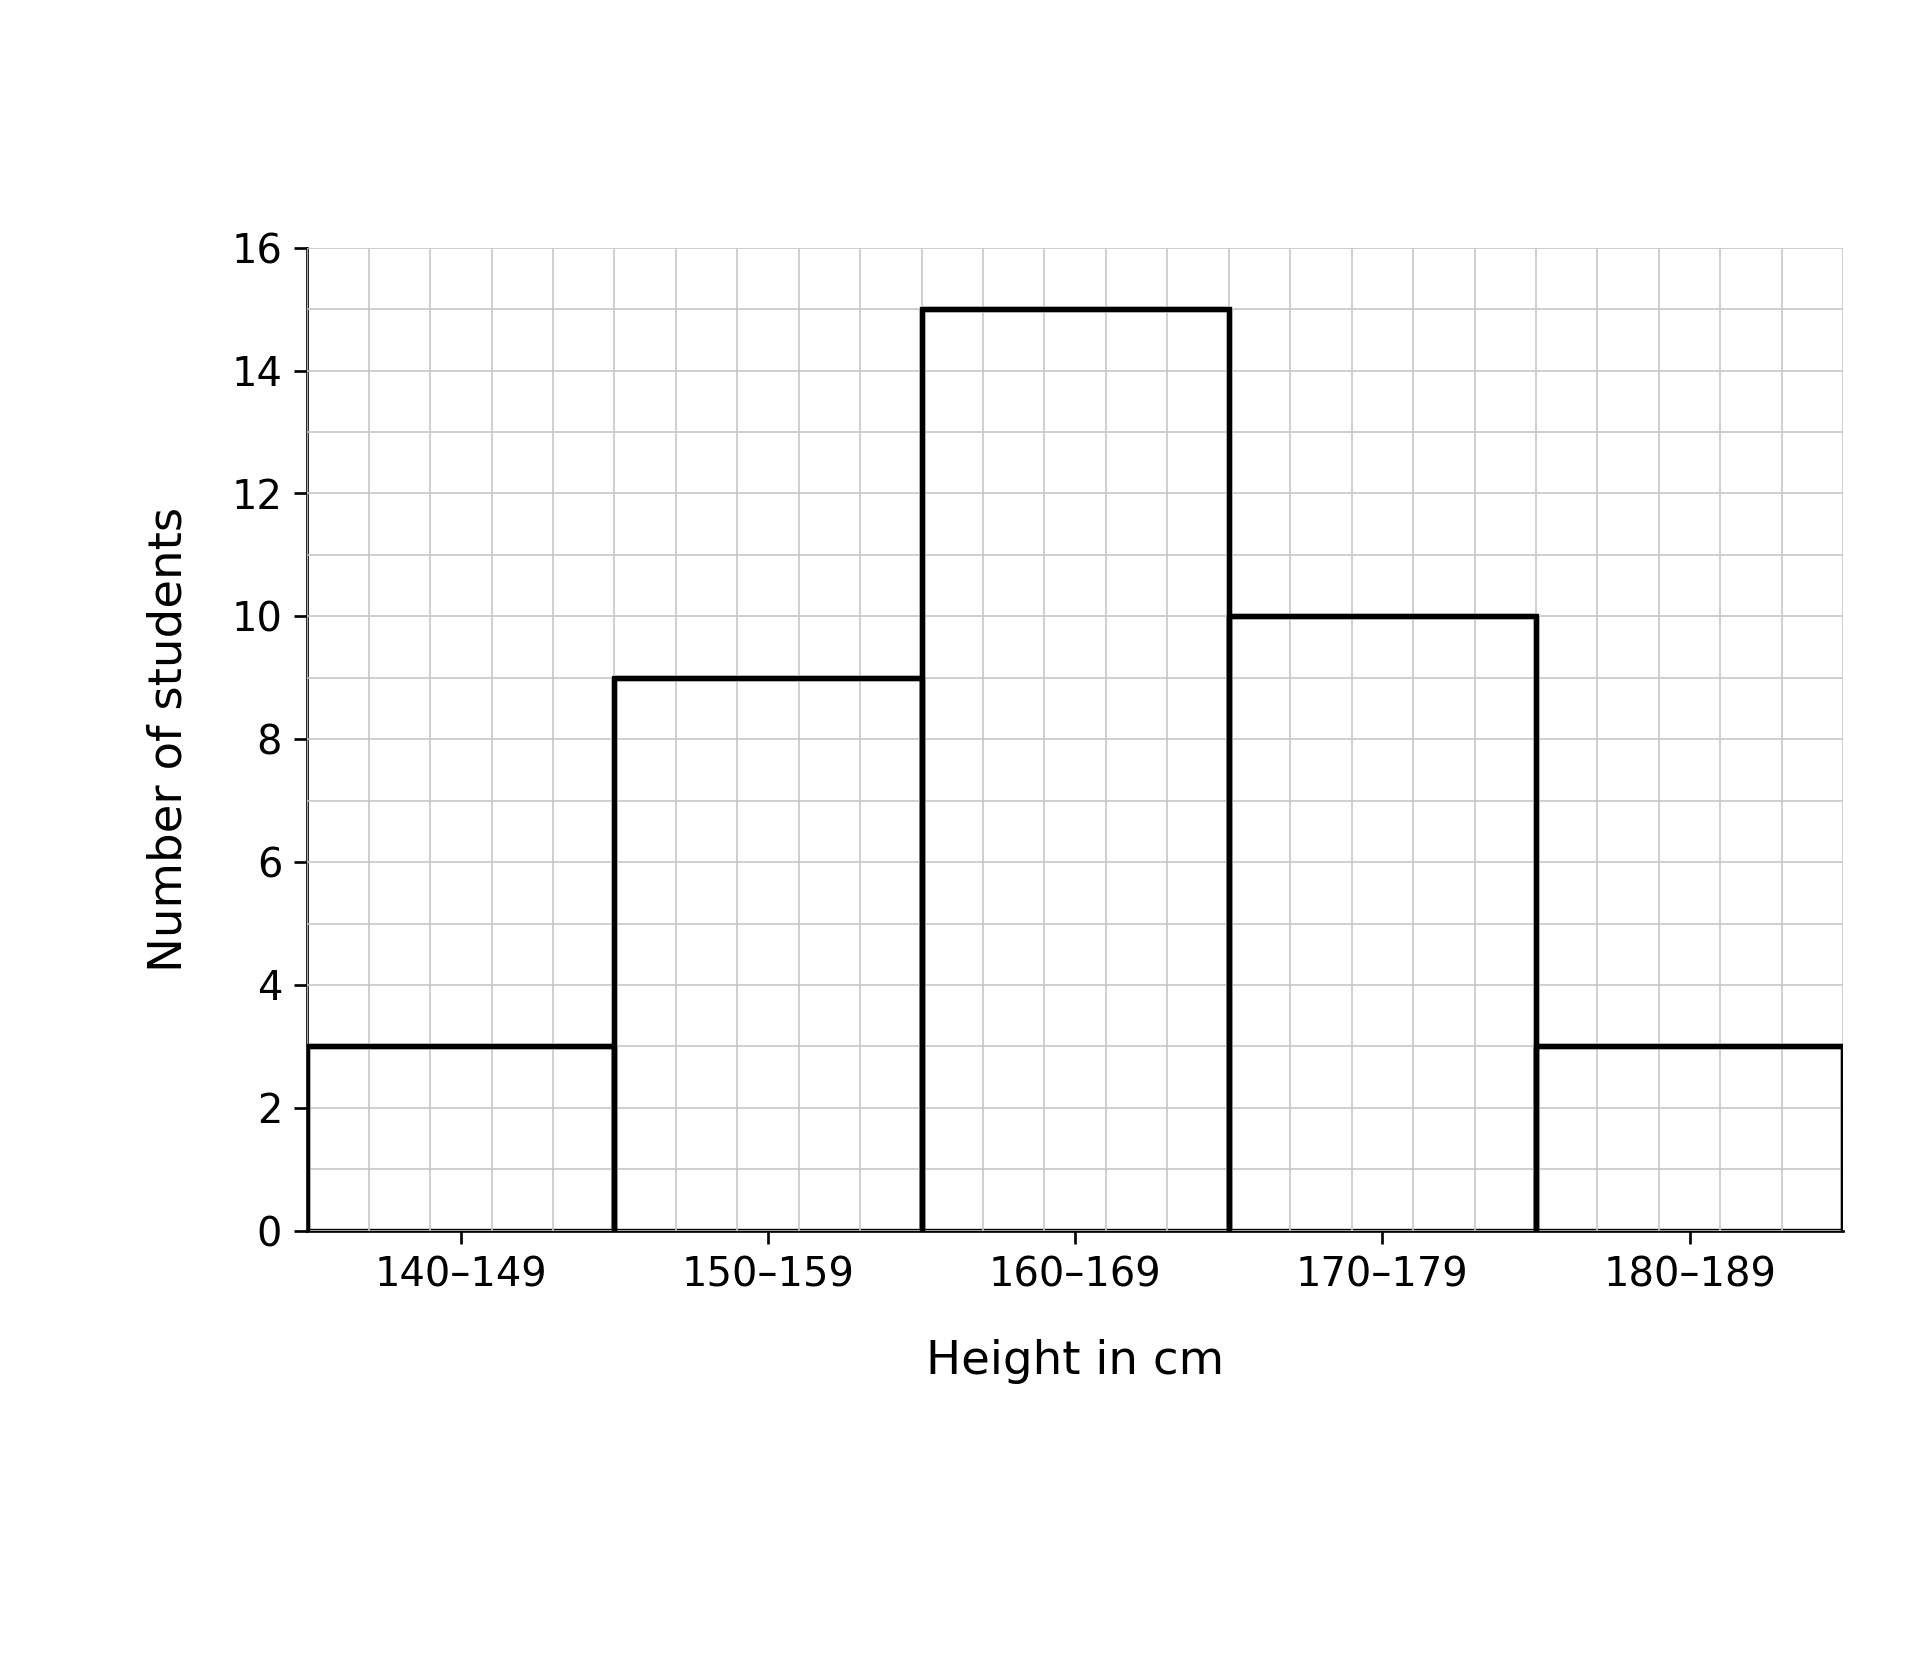
FA student collects data about 40 students in her year group.
She measures the height of each student. The Figure shows her results.
Figure
She also records the blood group of each student. The Table shows her results.
Table
| Blood group | A | B | AB | O |
|---|---|---|---|---|
| Number of students | 16 | 4 | 2 | 18 |
a.[1]
Give the most common range of heights.
b.[2]
Calculate the percentage of students with blood group O.
c.[2]
Height shows continuous variation. Blood group shows discontinuous variation.
Explain why.
d.[2]
Two of the students are identical twins. Identical twins have the same genome.
One twin is 4 cm taller than the other twin.
Explain why.
5.1 Inheritance Questions
186 exam-style questions on OCR GCSE Biology 5.1 Inheritance, covering 5.1.1 The genome, 5.1.2 Environment and phenotype, 5.1.3 Variants and mutations, 5.1.4 How genetic variants influence phenotype, 5.1.5 Asexual and sexual reproduction, 5.1.6 Haploid and diploid, 5.1.7 Meiotic cell division, 5.1.8 Single gene inheritance, 5.1.9 Predicting single gene crosses, 5.1.10 Sex determination, 5.1.11 Multiple gene inheritance, and 5.1.12 Development of our understanding of genetics. Each one has a worked solution and a mark scheme showing where the marks go.