Question 81
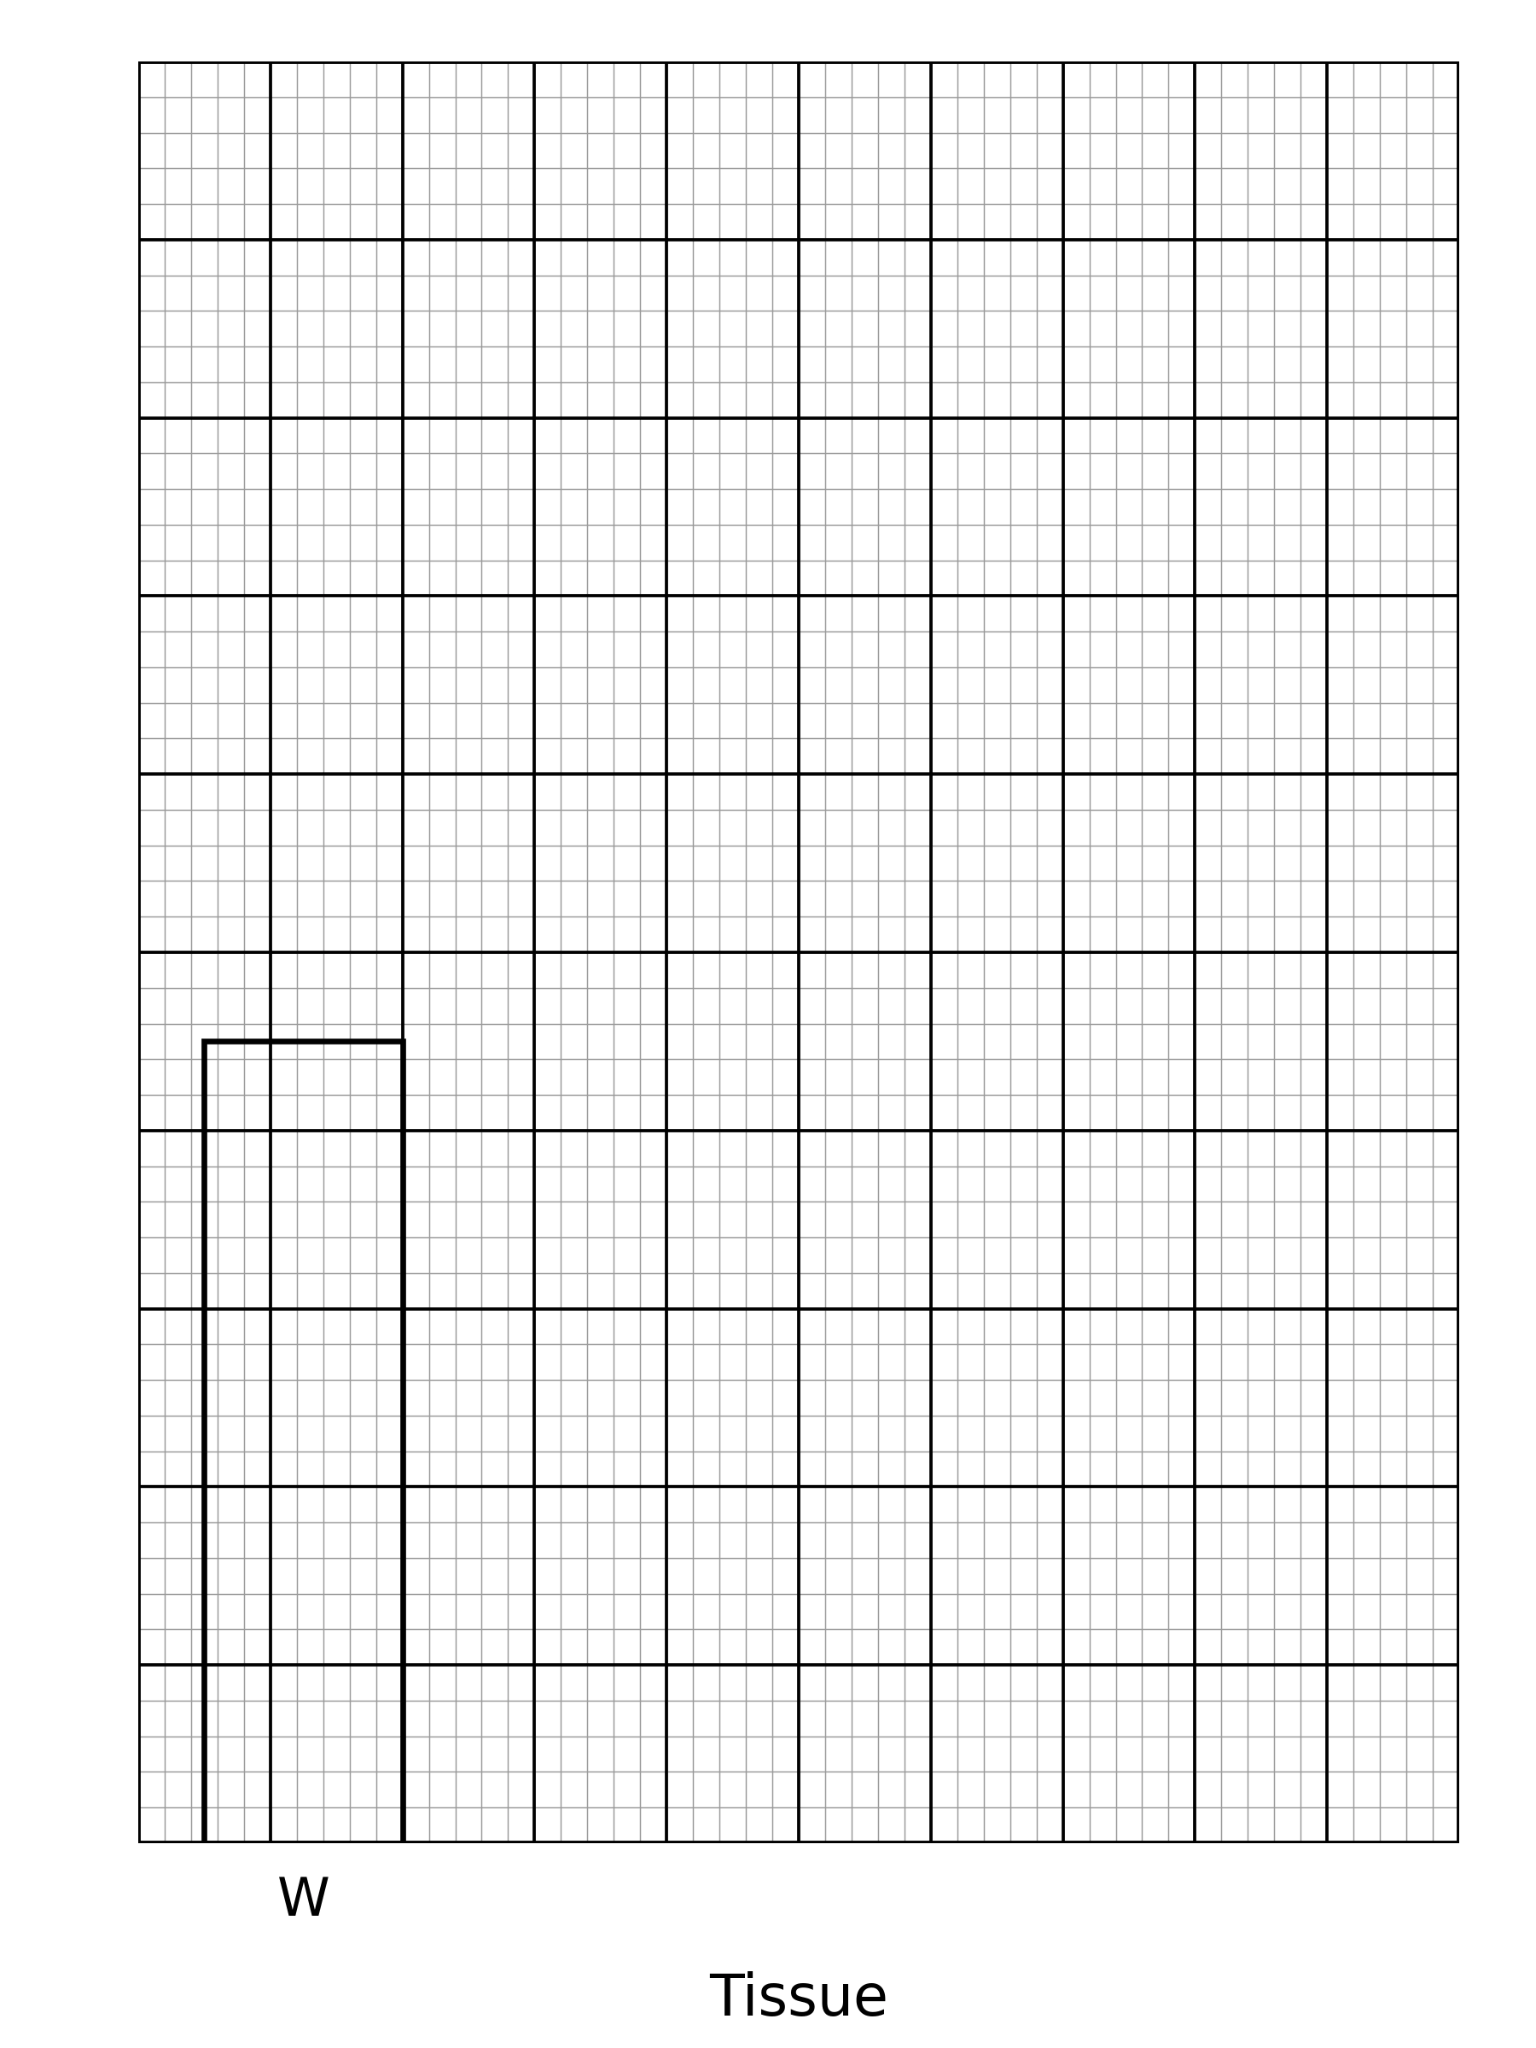
FA scientist took samples of four tissues, W, X, Y and Z, from a young mouse. For each tissue she found the percentage of cells that were still able to differentiate into other types of cell.
Table: The percentage of cells in each tissue that were still able to differentiate
| Tissue | Percentage (%) of cells still able to differentiate |
|---|---|
| W | 45 |
| X | 62 |
| Y | 20 |
| Z | 4 |
Figure: Grid for plotting the data in the table
a.[4]
Complete the figure. You should:
- label the y-axis
- add the correct scale to the y-axis
- plot the data from the table
- label each bar.
The bar for tissue W has been plotted and labelled for you.
b.[2]
Tissue Z is heart muscle.
Suggest what the data for tissue Z tell you about the cells in heart muscle.
c.[2]
The scientist repeated the investigation using the same four tissues taken from an old mouse.
The percentage of cells still able to differentiate was lower in every tissue.
Explain why.
1.1 Cell structure Questions
163 exam-style questions on AQA GCSE Biology 1.1 Cell structure, covering 1.1.1 Eukaryotes and prokaryotes, 1.1.2 Animal and plant cells, 1.1.3 Cell specialisation, 1.1.4 Cell differentiation, 1.1.5 Microscopy, and 1.1.6 Culturing microorganisms. Each one has a worked solution and a mark scheme showing where the marks go.