How Many Students Take GCSE Geography Each Year?
How many students take GCSE Geography? See the latest UK entry figures, recent trends, grade data and the maths skills behind the statistics clearly.
A subject-option form can make GCSE Geography feel like a small decision made in one classroom. Nationally, it is anything but small. So, how many students take GCSE Geography each year? The latest completed UK results series, summer 202520252025, recorded 302,706302{,}706302,706 GCSE Geography entries. That made Geography the sixth most popular GCSE full-course subject in the UK.
The number has also been rising. There were 297,411297{,}411297,411 entries in 202420242024 and 293,319293{,}319293,319 in 202320232023. Yet popularity does not mean Geography is automatically easier, nor does it determine how many students receive each grade. Entry figures, grade distributions and grade boundaries tell different parts of the story.
GCSE Geography popularity at a glance
Here are the central facts from the latest national results data:
- The UK recorded 302,706302{,}706302,706 GCSE Geography entries in summer 202520252025.
- Geography was the sixth most popular GCSE full-course subject.
- Entries rose by 5,2955{,}2955,295, or approximately 1.8%1.8\%1.8%, from 202420242024.
- Geography represented 4.9%4.9\%4.9% of all UK GCSE subject entries.
- Approximately 98%98\%98% of Geography entries came from students aged 161616.
- At the UK reporting benchmarks, 25.2%25.2\%25.2% achieved grade 777/A or above and 65.7%65.7\%65.7% achieved grade 444/C or above.
- Geography entries have increased by approximately 14%14\%14% since 201920192019.
One distinction matters immediately: official publications usually count entries, not unique students. One student taking eight GCSEs produces eight subject entries. The figure 302,706302{,}706302,706 is therefore the number of Geography qualifications entered, although it is a close practical answer to the number of candidates because students do not normally enter the same full-course subject twice in one series.
 A student discovers that every GCSE Geography option appears to involve more maps
How many students take GCSE Geography in recent years?
The recent UK figures show steady growth rather than a sudden surge.
| Summer series | UK GCSE Geography entries | Annual change |
|---|---|---|
| 201920192019 | 265,169265{,}169265,169 | Baseline comparison |
| 202320232023 | 293,319293{,}319293,319 | N/A |
| 202420242024 | 297,411297{,}411297,411 | +1.4%+1.4\%+1.4% |
| 202520252025 | 302,706302{,}706302,706 | +1.8%+1.8\%+1.8% |
From 202420242024 to 202520252025, the numerical increase was:
302,706−297,411=5,295302{,}706-297{,}411=5{,}295302,706−297,411=5,295The corresponding percentage change is based on the original, 202420242024 entry figure:
5,295297,411×100≈1.8%\frac{5{,}295}{297{,}411}\times 100\approx 1.8\%297,4115,295×100≈1.8%This is the same percentage-change structure students meet throughout GCSE Maths and in geographical data analysis. If distinguishing the original value from the new value feels uncertain, MathsGenie's percentage change revision guide explains the underlying method.
The wider context makes the rise more interesting. Total UK GCSE entries fell slightly in 202520252025, by around 0.4%0.4\%0.4%, while Geography entries increased by 1.8%1.8\%1.8%. Geography therefore grew both in raw entry numbers and as a share of all GCSE subject entries, moving from 4.8%4.8\%4.8% in 202420242024 to 4.9%4.9\%4.9% in 202520252025.
That does not mean 4.9%4.9\%4.9% of pupils chose Geography. The denominator is all subject entries, and each pupil normally contributes several of them. It means that roughly 4.94.94.9 in every 100100100 GCSE full-course entries were for Geography.
Why the England and UK figures are different
Students may encounter another 202520252025 number: 291,880291{,}880291,880. This was Ofqual's provisional Geography entry total for England, based on entries submitted to exam boards by a specified point before the summer examinations.
The final JCQ results data recorded 288,664288{,}664288,664 Geography entries for England and 302,706302{,}706302,706 across the UK. These figures are not contradictory. They cover different geographical areas and stages of the examination process:
- England provisional entries are an early count submitted before the examinations.
- England results entries reflect candidates included in the final results data.
- UK results entries also include Wales and Northern Ireland.
When interpreting a statistic, always check its population, date and definition. That habit is valuable in Geography, Statistics and GCSE Maths. MathsGenie's free GCSE Statistics revision hub provides further practice with the way data is collected, presented and interpreted.
Why is GCSE Geography so popular?
The national figures establish that Geography is popular, but they cannot prove exactly why individual students choose it. Subject choice may be influenced by interest, school option structures, future plans and the English Baccalaureate subject combination in England.
Geography also joins several kinds of thinking. Students learn physical and human content, interpret unfamiliar resources, evaluate evidence and apply fieldwork skills. It is neither purely an essay subject nor purely a data subject.
That mixture may appeal to students who like connecting ideas. A graph of population change is not simply a graph; it describes people and places. A calculation involving river discharge is not simply arithmetic; it helps explain a physical process. The mathematical tool has a geographical purpose.
Popularity has also been sustained. UK entries rose from 265,169265{,}169265,169 in 201920192019 to 302,706302{,}706302,706 in 202520252025, an increase of approximately 14%14\%14%. Geography has remained sixth in the ranking of GCSE full-course subjects rather than briefly appearing after one unusual year.
What popularity says about how Geography is graded
The short answer is: much less than people often assume.
A popular subject is not automatically marked more harshly because more students take it. Nor is it automatically easier because many students select it. Examination boards set grade boundaries after considering the difficulty of the papers and evidence from student performance. If a paper is more demanding than expected, boundaries can be lower; if it is less demanding, they can be higher.
GCSE Geography is also not separated into Foundation and Higher tiers in the way GCSE Maths is. Students taking a particular Geography specification sit its common assessment route and can access the full grade range. Paper structures vary between AQA, Edexcel, OCR and Eduqas, so boundaries must be read for the correct board, specification and examination series.
In the 202520252025 UK results, the key Geography outcomes were:
| Reporting benchmark | Percentage of Geography entries |
|---|---|
| Grade 777/A and above | 25.2%25.2\%25.2% |
| Grade 444/C and above | 65.7%65.7\%65.7% |
| Grade 111/G and above | 98.0%98.0\%98.0% |
JCQ uses combined benchmarks such as 777/A and 444/C to report across UK jurisdictions with different grading systems. England uses grades 999 to 111, while Wales and Northern Ireland may use letter-based scales.
These percentages describe the outcome distribution, not the probability that any particular student will receive a grade. Students selecting different subjects are not identical groups. They may have different prior attainment, school provision or reasons for entering. Comparing the percentage of grade 777s in two subjects cannot, by itself, tell you which subject is harder.
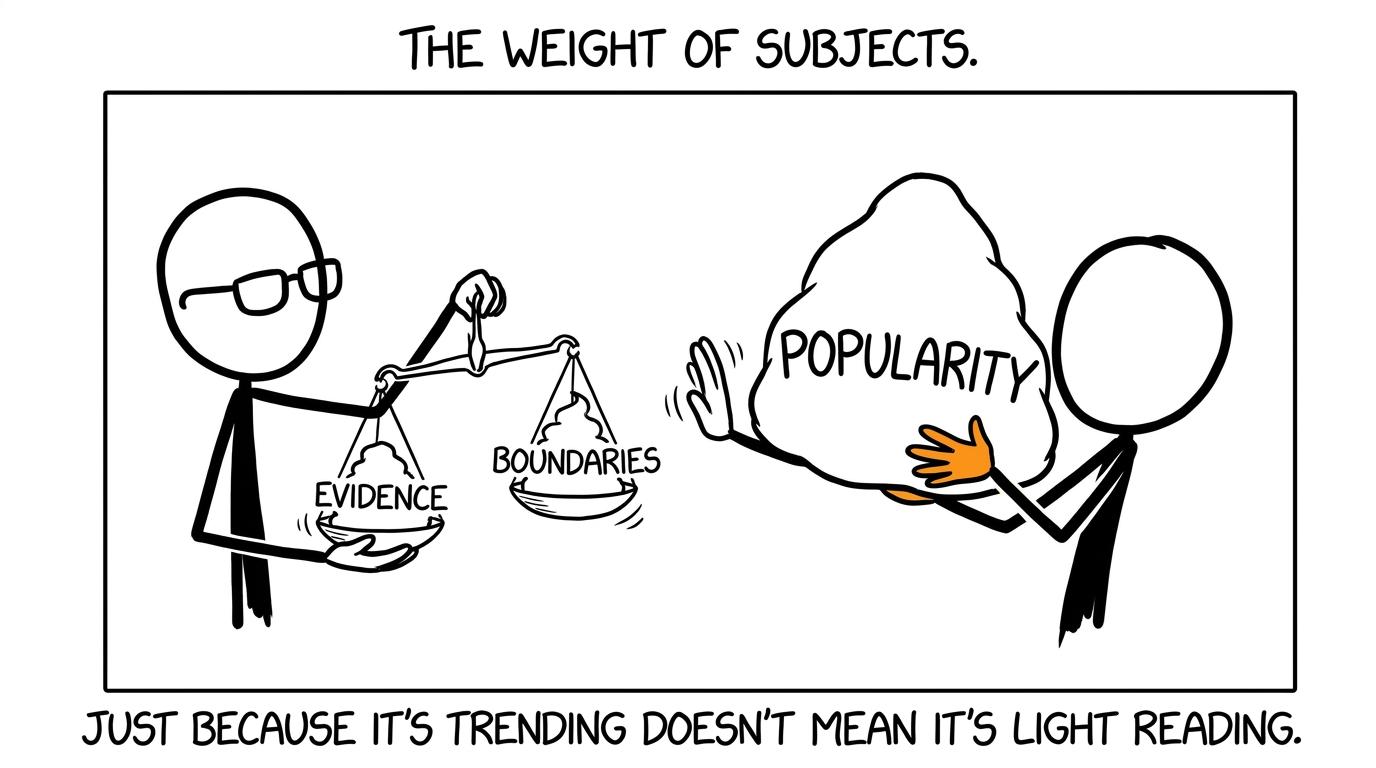 An examiner refuses to place subject popularity on the grade-boundary scales
The maths hidden inside GCSE Geography
For a maths student, Geography offers a useful reminder that numerical skills rarely arrive with a label saying which method to use. The data comes first; you must decide what it means.
Across GCSE Geography specifications, quantitative skills can include:
- percentages and percentage change;
- ratio, proportion, scale and distance;
- averages and measures of spread;
- cumulative frequency and quartiles;
- scatter graphs and lines of best fit;
- interpreting tables, maps, charts and population pyramids;
- accuracy, sampling, reliability and anomalies;
- drawing conclusions from numerical evidence.
OCR's Geography A specification, for example, states that at least 10%10\%10% of the overall assessment marks are targeted at the use of mathematics and statistics in Geography. Exact assessment arrangements depend on the specification, but the broader lesson is consistent: confident data skills can support performance beyond the maths classroom.
MathsGenie's AQA Geography statistical skills guide covers scatter graphs, cumulative frequency, averages, spread and percentage change in a geographical setting. For deeper practice, the main GCSE Maths revision hub lets you select Edexcel, AQA, OCR, Eduqas and other boards.
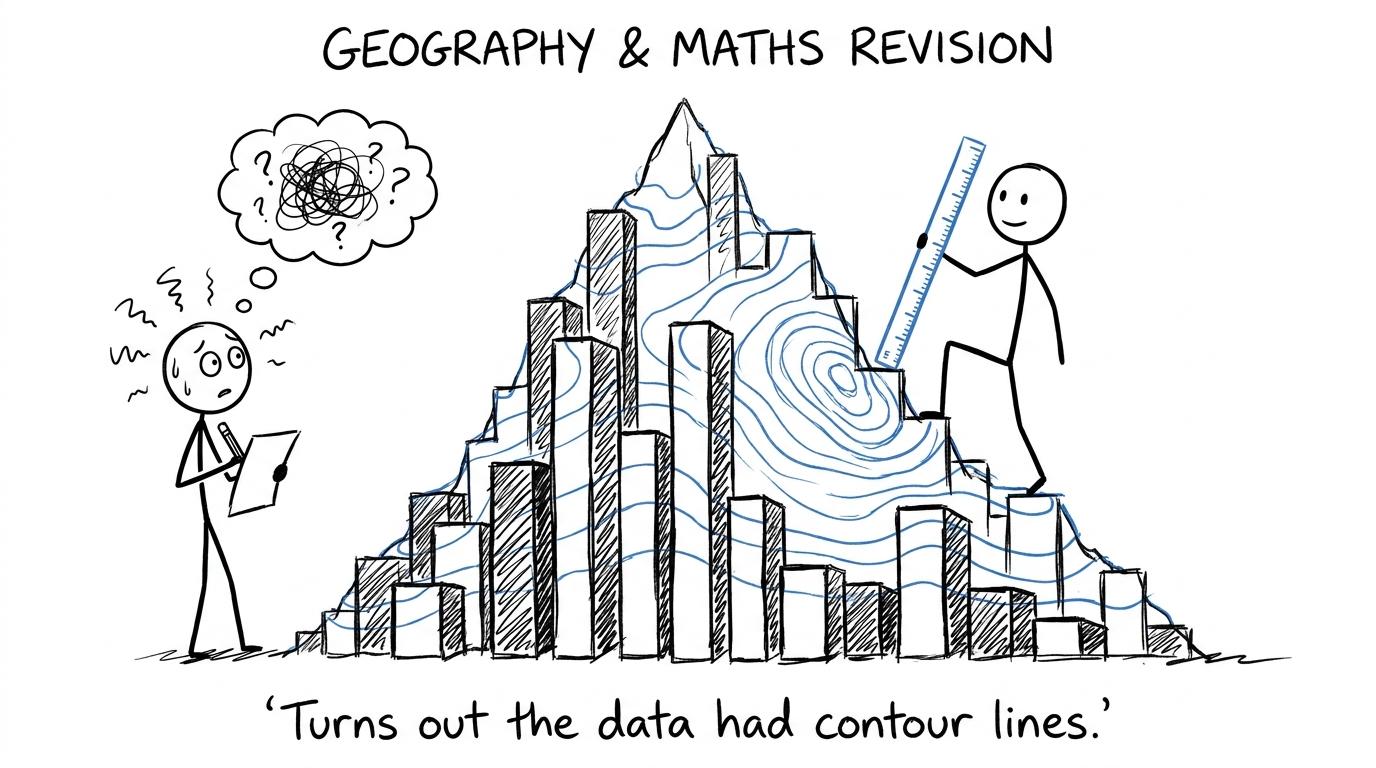 A student prepares to climb a mountain made entirely from charts
What maths students can learn from these figures
National entry data is a compact exercise in statistical literacy. Four questions keep the interpretation honest:
What is being counted?
The data counts examination entries, not the total number of pupils in the UK and not the number who considered Geography before choosing something else.
What is the comparison period?
An annual rise of 1.8%1.8\%1.8% describes the movement from 202420242024 to 202520252025. The longer change since 201920192019 is approximately 14%14\%14%. Both statements are correct, but they answer different questions.
Is the number provisional or final?
Provisional entry statistics are useful for early trends. Final results statistics are better for reporting how many entries ultimately appeared in the results series.
Does correlation prove a cause?
Rising entries alongside stable grade outcomes do not prove that one caused the other. The figures alone cannot explain why students selected the subject or why an individual achieved a particular grade.
These habits transfer directly to questions involving charts, samples and misleading statistics. Students taking Edexcel can develop them through the Edexcel GCSE Maths revision pathway, while AQA students can test their interpretation under timed conditions with AQA GCSE Maths past papers.
Common mistakes when reading GCSE entry data
Treating entries as a count of all pupils
Each student takes several subjects, so the total number of GCSE entries is much larger than the number of GCSE candidates. Subject entries should not be confused with unique pupils.
Mixing England with the whole UK
England-only Ofqual figures and UK-wide JCQ figures have different coverage. Wales and Northern Ireland must be included before describing a figure as UK-wide.
Confusing percentage change with percentage-point change
Geography's share rose from 4.8%4.8\%4.8% to 4.9%4.9\%4.9%. That is an increase of 0.10.10.1 percentage points, not an increase of 0.1%0.1\%0.1%.
Assuming more entries cause higher or lower grades
Grade boundaries respond to the standard and difficulty of assessment, not a simple popularity rule. More candidates do not automatically make a grade easier or harder to obtain.
Comparing raw boundaries across exam boards
A boundary only makes sense with its maximum mark, paper structure, specification and series. AQA, Edexcel, OCR and Eduqas papers are not interchangeable.
Turn data curiosity into better maths revision
The latest answer is clear: just over 302,000302{,}000302,000 UK entries were recorded for GCSE Geography in 202520252025, making it the sixth most popular full-course GCSE. Its steady growth tells us that Geography remains a major option. It does not tell us that the qualification is easy, or that grades are awarded according to popularity.
The more useful lesson is about evidence. Read the label, identify the population, check the time period and distinguish an entry figure from a grade outcome. Those small habits are exactly what protect marks in statistics questions.
Use MathsGenie to turn them into a reliable revision routine. Begin with free revision lessons and practice questions, then move to mini tests, past papers and predicted papers. Mark each attempt carefully with the mark scheme, use video solutions to repair weak methods, and add the next task to your revision planner. The goal is not merely to see more data; it is to become harder for data to mislead.