GCSE Statistics Grade Boundaries: Results Day 2026
GCSE statistics grade boundaries explained for 2026: learn when they are set, how marks become grades, and what to check calmly on results day.
Opening a results envelope can make months of work feel compressed into one line. Before that moment arrives, rumours about GCSE statistics grade boundaries often make the waiting harder. The useful truth is simpler: boundaries convert your total raw mark into a grade, they are set after papers have been marked, and the official 2026 figures cannot be known reliably in advance.
GCSE results day in England is Thursday 20 August 2026. Your result reflects the quality of your work, not a fixed percentage or a quota deciding how many students may pass.
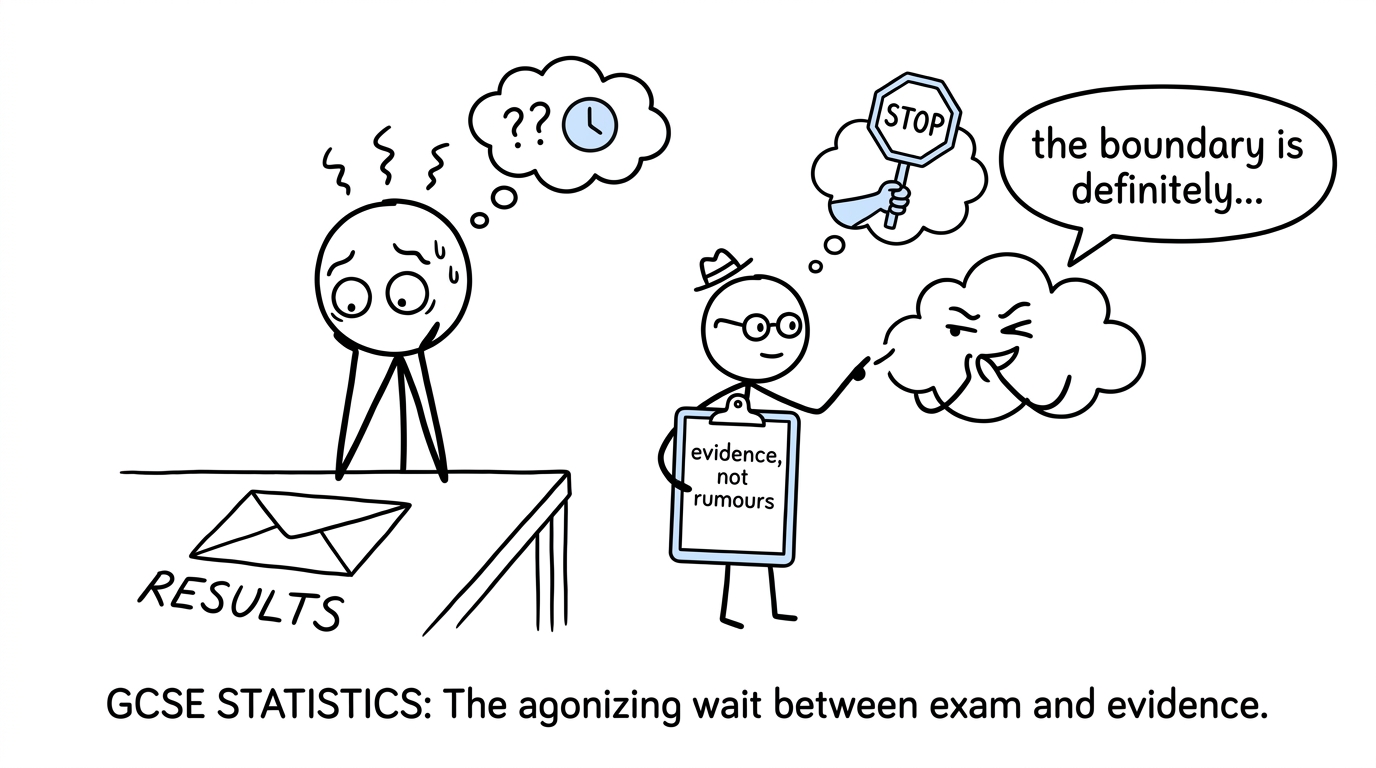 A student ignoring grade-boundary rumours while awaiting GCSE Statistics results
GCSE Statistics results day checklist
When you receive your result:
- confirm that the subject, exam board and tier are correct;
- find your final grade and, if provided, your total raw mark;
- use the boundary table for the correct board, qualification and exam series;
- compare your total qualification mark, not an isolated paper mark, with the overall boundaries;
- speak to your school if something appears wrong or you are close to an important boundary;
- avoid comparing marks across different boards or years.
MathsGenie's GCSE Statistics revision hub brings together board-specific past papers, questions, worksheets and a grade calculator, making it a useful place to understand the structure behind your result.
What are GCSE Statistics grade boundaries?
A grade boundary is the minimum raw mark needed for a particular grade. Suppose the boundary for grade 7 were 989898 marks. A total of 989898 or more would reach grade 7, provided it remained below the grade 8 boundary.
Boundaries are not fixed percentages. There is no permanent rule such as “grade 7 always requires 70%70\%70%”. Exam boards set boundaries after examining marking evidence and student performance. Senior examiners also consider the demand of the papers and the standard of work shown around possible boundaries.
If a paper proves more demanding than intended, boundaries may be lower. If it proves less demanding, they may be higher. The aim is to maintain a comparable standard between years rather than reward or punish a cohort for receiving a particular paper.
Ofqual has confirmed that there is no predetermined quota for how many students must pass, fail or receive each grade in 2026.
Are statistics grade boundaries 2026 available yet?
Official statistics grade boundaries 2026 are not available before the awarding process is completed. Any table circulating beforehand is a prediction, estimate or rumour rather than an official boundary document.
That distinction matters. A prediction can appear precise while still being wrong by several marks. Those marks can be the difference between adjacent grades.
On results day, check the publication issued by your own awarding organisation. GCSE Statistics is currently supported by MathsGenie for AQA, Edexcel and CCEA. Do not accidentally use a GCSE Maths table, an old specification or a boundary from another board.
Students following AQA can use the AQA GCSE Statistics revision page, while those taking Pearson Edexcel can find their resources through the Edexcel GCSE Statistics revision page.
How your Statistics marks become a grade
GCSE Statistics is assessed across more than one paper. Your raw marks are added before the overall subject boundary is applied. A weak moment on one paper does not create a separate final grade for that paper; what matters is the combined qualification total.
The process is:
total raw mark=Paper 1 mark+Paper 2 mark\text{total raw mark}=\text{Paper 1 mark}+\text{Paper 2 mark}total raw mark=Paper 1 mark+Paper 2 markThe exam board then compares this total with its overall grade-boundary table. Documents may also show notional component boundaries for individual papers. These can help schools analyse performance, but they do not normally determine your qualification grade independently.
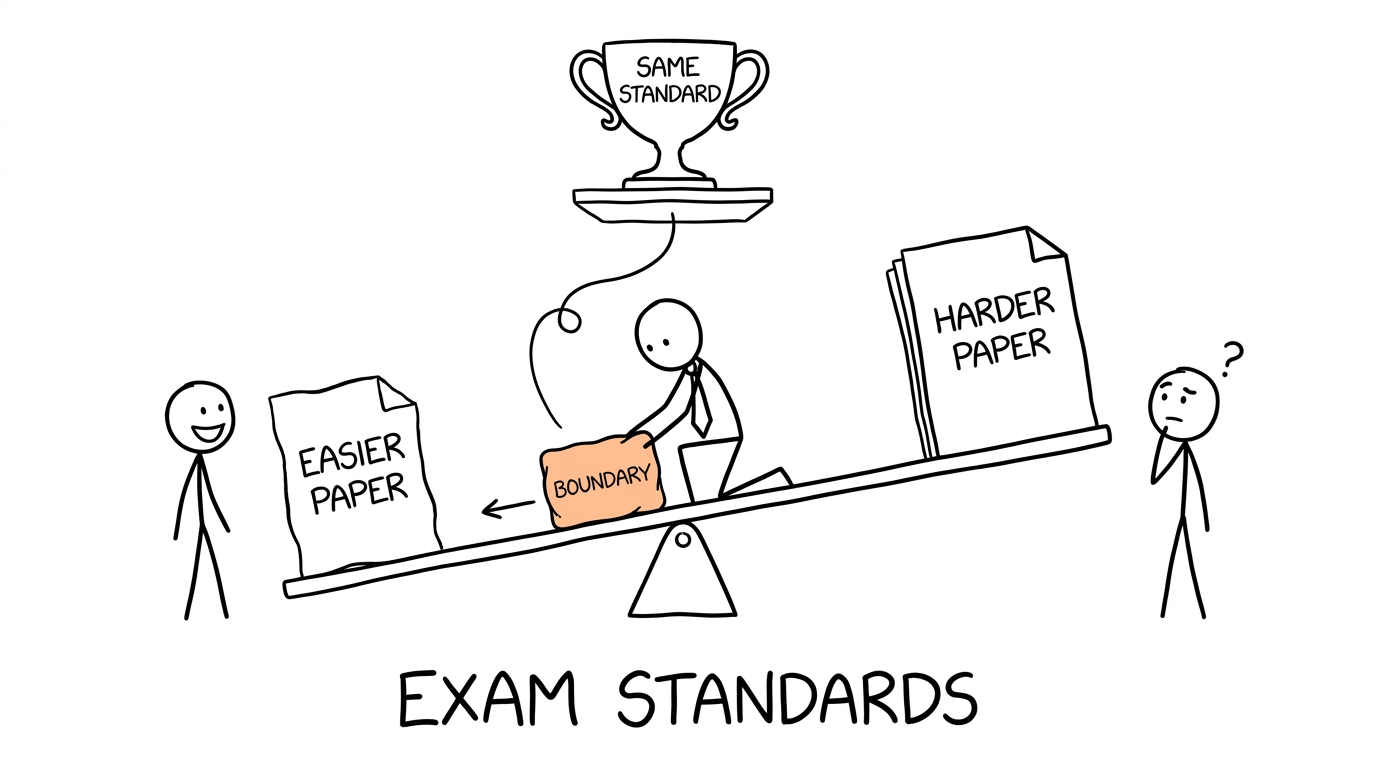 An examiner balancing paper difficulty while maintaining the same grading standard
Worked boundary example
The following figures are fictional and are included only to show how a boundary table works.
Imagine a Higher tier qualification with 160160160 available marks and these boundaries:
| Grade | Minimum total mark |
|---|---|
| 9 | 126126126 |
| 8 | 110110110 |
| 7 | 949494 |
| 6 | 787878 |
| 5 | 626262 |
| 4 | 474747 |
| 3 | 353535 |
A student receives 434343 marks on Paper 1 and 525252 marks on Paper 2:
43+52=9543+52=9543+52=95Their total is 959595. This reaches the fictional grade 7 boundary of 949494, but not the grade 8 boundary of 110110110. Their grade would therefore be 7.
Their percentage would be:
95160×100=59.375%\frac{95}{160}\times 100=59.375\%16095×100=59.375%That percentage does not determine the grade by itself. The decisive comparison is between the raw total of 959595 and the official boundary table.
Foundation and Higher tier boundaries
Tier matters because the available grades differ. Foundation tier generally awards grades 1 to 5, while Higher tier generally awards grades 4 to 9, with a narrow grade 3 safety net for students who narrowly miss grade 4. Students below that safety-net boundary receive an unclassified result.
Always read the row matching the tier entered by your school. A Foundation mark should not be compared with Higher boundaries, even when the papers have the same maximum total.
What to do if you are close to a boundary
Being one mark below a boundary does not automatically mean that an error occurred. It does mean that you may want to discuss the result with your exams officer or teacher, particularly where the grade affects sixth-form or college entry.
Your school can explain the available post-results services, possible fees, deadlines and risks. A review of marking checks whether the mark scheme was applied correctly; it is not a request for extra marks, and the mark can stay the same, rise or fall. Do not submit anything informally or rely on social-media advice.
If you plan to continue with a statistics-rich subject, strengthen any weaker areas using resources such as averages from frequency tables, histograms revision and standard deviation questions.
Common mistakes on GCSE Statistics results day
The most common errors come from reading the right number in the wrong context:
- treating an unofficial prediction as a confirmed 2026 boundary;
- checking GCSE Maths instead of GCSE Statistics;
- using another exam board's table;
- reading a paper-level notional boundary as the overall subject boundary;
- comparing a raw mark with a percentage boundary;
- forgetting to check Foundation or Higher tier;
- assuming a lower boundary means standards have fallen;
- believing that only a fixed proportion of students can pass.
Grade boundaries are better understood as an adjustment for paper difficulty. The number can move while the expected standard of work remains comparable.
Take the next step with MathsGenie
Results day gives you an outcome, but it does not reduce your ability to improve to one grade. If you are continuing with maths, statistics, science, psychology, economics or geography, the methods you developed still matter.
Start with the free GCSE Statistics revision guides and resources. Use revision lessons to rebuild uncertain topics, practise exam-style questions, and check your reasoning against mark schemes and solutions. Past papers reveal recurring demands; mini tests make gaps manageable; predicted papers help focus future exam preparation without pretending to predict exact boundaries.
The envelope records what happened in one exam series. Your next piece of practice decides what happens after it.