GCSE Geography Cross Curricular Overlap: Does It Help?
GCSE geography cross curricular overlap can save revision time. See where geography supports maths, science and English, and where separate practice matters.
Revision can sometimes feel as if every subject lives in its own locked room. Percentages belong to maths. Climate belongs to geography. Data analysis appears in science. Then, during a geography paper, you meet a scatter graph, calculate percentage change and evaluate whether a sample is reliable.
That is GCSE geography cross curricular overlap in action. Yes, it genuinely helps, particularly with maths, science and English, because the same underlying skills appear in different contexts. The important distinction is that overlap can reduce repeated learning, but it cannot replace subject-specific knowledge or exam practice.
The aim is not to revise everything twice. It is to learn a transferable skill once, then practise applying it in each subject.
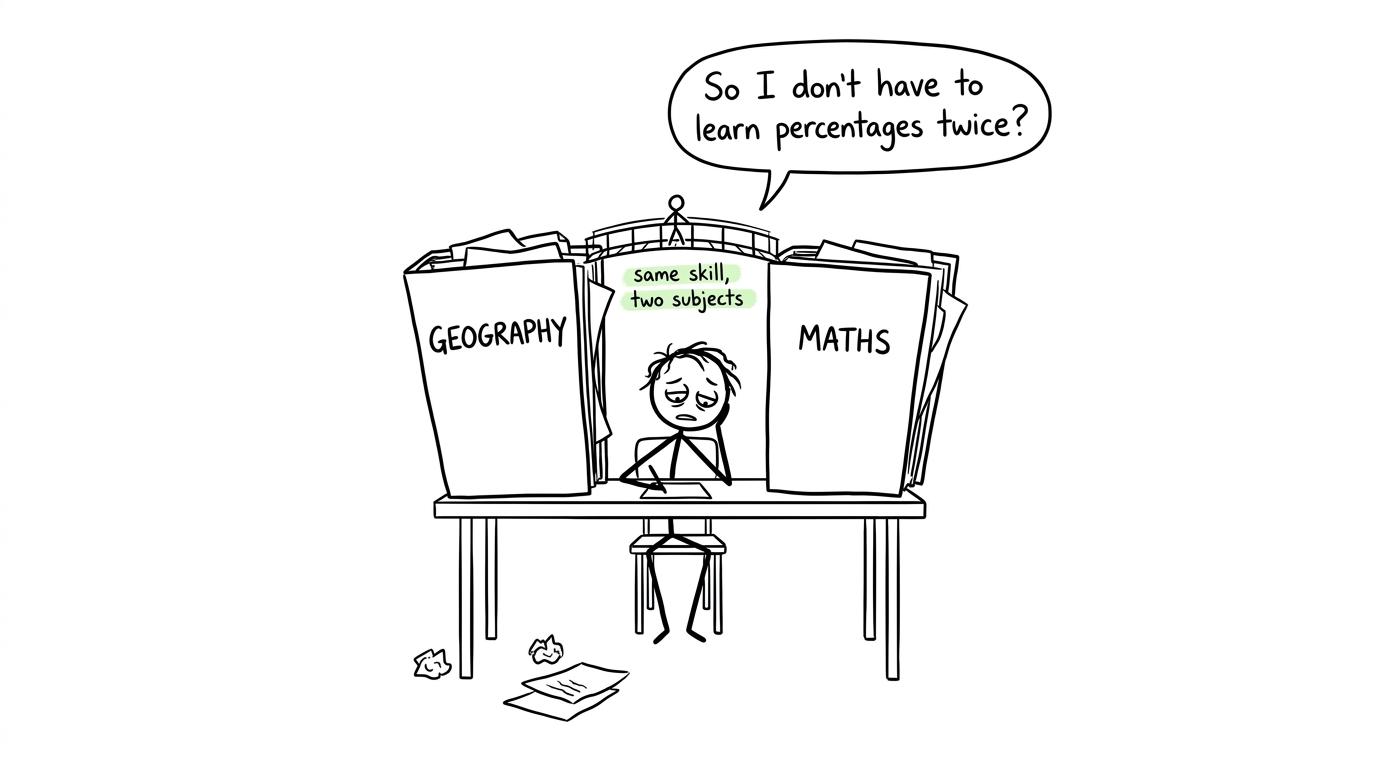 A student discovers a bridge between geography and maths revision folders
The quick cross-curricular checklist
When planning revision, separate portable skills from subject knowledge.
| Geography task | Useful overlap | What remains geography-specific |
|---|---|---|
| Interpreting graphs and tables | Maths, science and computing | Explaining the geographical pattern |
| Calculating percentages and averages | Maths, science and business | Connecting the result to places or processes |
| Using map scales and distances | Maths | Reading geographical and OS map information |
| Analysing fieldwork data | Maths and science | Evaluating the geographical enquiry |
| Explaining causes and effects | English, history and science | Accurate case-study knowledge |
| Evaluating an issue | English and citizenship | A balanced geographical judgement |
A sensible revision rule follows:
- Share the method when the underlying skill is the same.
- Change the context when moving between subjects.
- Practise the exam language required by each specification.
- Keep separate knowledge lists for case studies, terminology and processes.
Why geography and maths overlap so much
GCSE geography is not simply a collection of facts about rivers, cities and tectonic hazards. It also asks students to interpret evidence about the world.
The national requirements for GCSE geography include cartographic, graphical, numerical and statistical techniques. At least 10%10\%10% of the marks across the qualification must assess mathematical and statistical techniques. Individual specifications from AQA, Edexcel, OCR and Eduqas organise their papers differently, so always check your own exam board, but quantitative skills are a formal part of the subject rather than an optional extra.
That creates substantial overlap with the statistics, ratio and measures content found in GCSE maths at both foundation and higher tier.
Percentages, proportion and rates of change
Geography frequently uses proportions to compare populations, land use, survey responses and changes over time. The mathematical structure is the same one used in GCSE maths:
Percentage of a total=partwhole×100\text{Percentage of a total}=\frac{\text{part}}{\text{whole}}\times 100Percentage of a total=wholepart×100For percentage change, the denominator must be the original value:
Percentage change=new value−original valueoriginal value×100\text{Percentage change}=\frac{\text{new value}-\text{original value}}{\text{original value}}\times 100Percentage change=original valuenew value−original value×100Learning these methods through GCSE percentages revision supports both subjects. Geography then adds another demand: you must interpret what the calculated result means for the place, population or process in the question.
The calculation is transferable. The explanation is contextual.
Averages, spread and fieldwork data
Fieldwork turns a place into a data set. Students may need to choose or interpret the mean, median, mode, range, quartiles or interquartile range. These measures do different jobs:
Mean=total of the valuesnumber of values\text{Mean}=\frac{\text{total of the values}}{\text{number of values}}Mean=number of valuestotal of the values Range=largest value−smallest value\text{Range}=\text{largest value}-\text{smallest value}Range=largest value−smallest valueThe mean can be affected by unusually high or low values, while the median may offer a more representative centre for skewed data. The range and interquartile range describe spread rather than a typical value.
Use MathsGenie's mean, median, mode and range lesson to secure the calculations. Then return to geography and ask the additional questions: Was the sample large enough? Was the collection method consistent? Could time, location or researcher judgement have introduced bias?
This is where geography improves mathematical maturity. A correct calculation does not automatically make the conclusion trustworthy.
Graphs, correlation and cautious conclusions
Bar charts, line graphs, pie charts, histograms with equal class intervals and scatter graphs occur within geographical skills. Population pyramids, choropleth maps, flow-line maps and radial diagrams add displays that are more characteristic of geography.
Scatter graphs provide especially useful overlap. In both maths and geography, you should be able to identify positive, negative or no correlation, use a line of best fit and recognise the danger of extrapolation.
However, correlation does not by itself establish causation. A geographical answer should consider processes, other variables and the quality of the evidence. You can strengthen the underlying technique through scatter graphs revision, choosing the page for your own board through the main revision hub where available.
 A revision detective investigates a graph with missing units
Scale, distance, area and units
Map work connects directly to ratio, proportion and unit conversion. A representative fraction such as 1:n1:n1:n means that one unit on the map represents nnn of the same units on the ground.
The word same matters. Mixing centimetres, metres and kilometres is one of the easiest ways to lose marks.
Geography extends the mathematical skill through grid references, contours, spot heights, transects and gradient. Maths supplies the numerical machinery; geography supplies the spatial meaning. If scales feel uncertain, revisit scale drawings revision before applying the skill to maps.
Where geography overlaps with science
Physical geography and science often describe the same planet from different viewpoints. Climate systems, ecosystems, the carbon cycle, rock processes, weather hazards and environmental change may connect with biology, chemistry or physics.
The most useful shared skills include:
- reading graphs and identifying trends;
- understanding variables and control measures;
- selecting samples and considering reliability;
- using units, rates and quantitative comparisons;
- distinguishing observations from conclusions;
- evaluating limitations in methods and evidence.
Fieldwork and science practicals both reward careful thought about data collection. Repeating measurements may improve reliability, but repetition does not automatically remove systematic bias. A larger sample may be more representative, but only if the sampling approach suits the enquiry.
Do not merge the subjects completely. A science explanation may require particle behaviour, energy transfer or biological mechanisms. Geography may require spatial variation, human interaction, scale and a named context. Shared foundations help you think, but specifications decide what earns marks.
Where geography overlaps with English and history
Geography answers are often data-led arguments. That creates meaningful overlap with English writing and historical reasoning.
An effective extended response usually needs:
- a direct answer to the question;
- precise subject terminology;
- evidence selected for a purpose;
- linked causes, effects or consequences;
- consideration of alternatives;
- a justified conclusion.
English helps with paragraph control and clarity. History helps with causal chains, significance and evaluating evidence. Geography adds place, scale, interdependence and environmental or human processes.
A polished paragraph without geographical knowledge will remain weak. Equally, a page of remembered facts without a logical argument may not answer the question. Transfer the structure, not a memorised paragraph.
How to use the overlap without revising twice
The most efficient approach is to organise some revision by skill family, not only by subject.
Build one transferable skills list
Create a short list containing percentages, ratio, averages, spread, graphs, sampling, scale and unit conversion. Diagnose these skills using the GCSE maths revision hub or the broader GCSE Statistics revision area.
If percentage change is weak, learn and practise the method in maths. You do not need a second set of geography notes explaining the identical calculation.
Add a subject-specific final step
After practising the method, complete one geography question that uses it. Your final sentence should interpret the result geographically. After graph work, describe the pattern and explain a plausible process. After calculating an average, consider whether it supports the fieldwork conclusion.
This small context switch is essential. Knowing a method in isolation does not guarantee that you will recognise it inside another subject.
Keep one mistake log with subject labels
Record whether each error was caused by:
- a mathematical method;
- units or rounding;
- graph reading;
- geographical knowledge;
- command-word interpretation;
- weak evaluation.
A mathematical error should trigger maths practice. A missing case-study detail belongs in geography revision. This prevents you from rereading an entire topic when only one component is weak.
MathsGenie's guide to GCSE maths topics by exam board and tier can help you locate the relevant foundation or higher skill. For a sustainable weekly structure, adapt the GCSE maths revision timetable rather than creating separate, repetitive sessions.
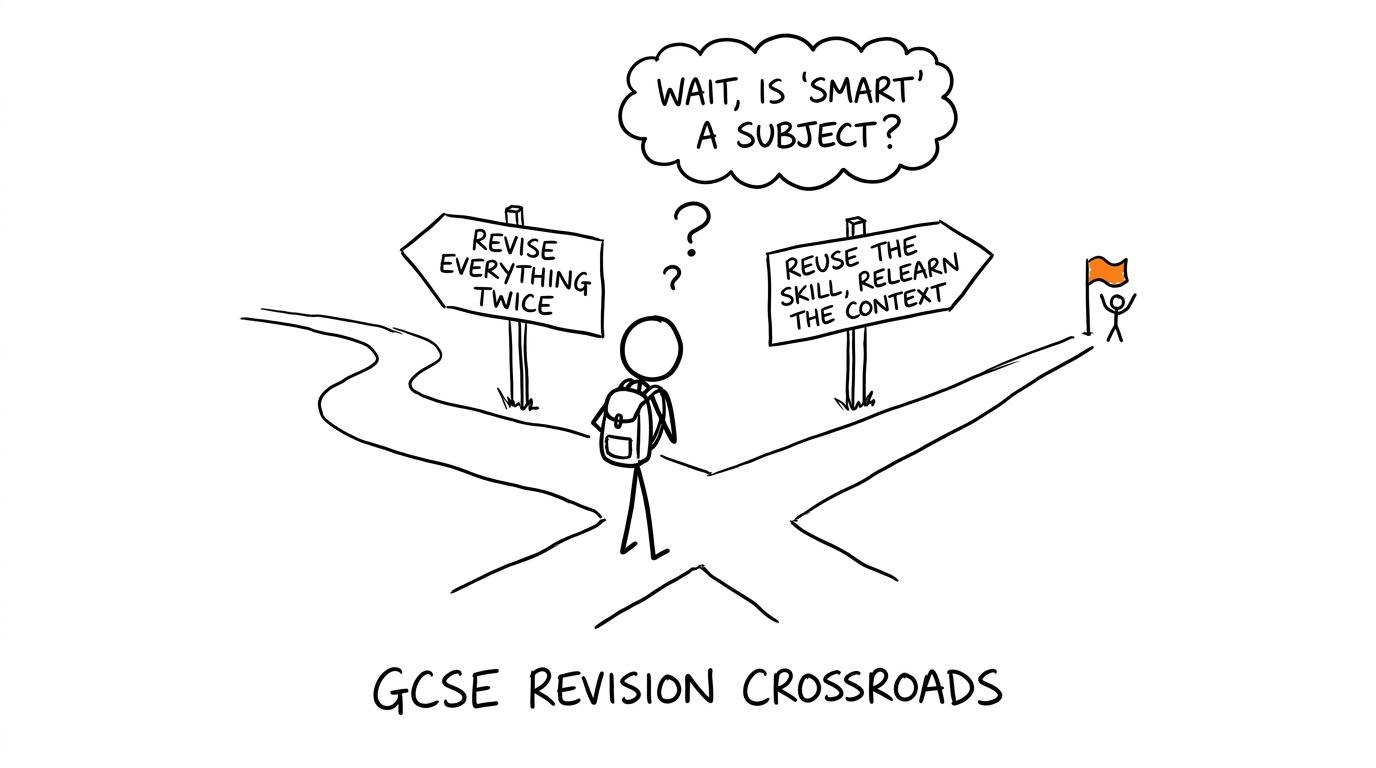 A student chooses the shorter revision path by reusing skills
Common mistakes when combining subject revision
Assuming the wording will be identical
A maths question may ask you to calculate or estimate. Geography may ask you to describe, analyse, assess or evaluate using the result. Read the command word before deciding what the question requires.
Giving a number without geographical meaning
A calculated value is often only the beginning. Include suitable units and connect the answer to the location, trend or enquiry being considered.
Confusing correlation with cause
A relationship on a scatter graph supports a statement about association. It does not automatically prove that one variable caused the other.
Revising shared content only in the easiest subject
Familiarity can be deceptive. You may calculate a mean correctly in maths but overlook it in a crowded geography resource booklet. Practise recognising the same skill in both settings.
Treating overlap as a substitute for specifications
Edexcel, AQA, OCR and Eduqas may present content and assessments differently. Use cross-curricular revision to strengthen shared skills, but follow the specification, teacher guidance and past papers for each actual course.
Make one skill work harder
Cross-curricular revision is not about pretending that several GCSEs are secretly the same subject. They are not. It is about noticing that a reliable skill can travel.
Learn percentage change once. Understand averages properly. Become careful with units. Read graphs sceptically. Then carry those habits into geography, science, business and any other subject that uses evidence.
Start at MathsGenie's free GCSE maths revision hub. Use revision lessons and practice questions to repair the shared skill, mark your work carefully with mark schemes and video solutions, then test it through mini tests, past papers and predicted papers. Finally, apply it in a geography question and add the subject-specific interpretation.
That is how overlap saves time without creating gaps: one strong method, several deliberate applications.