

A-Level Grade Inflation Explained: Historic Comparison
A-level grade inflation explained through the 2019-2025 timeline, with pandemic assessment, grade boundaries and fair historic comparisons for students.
Results day can make one percentage feel like a verdict on an entire generation. A rise in top grades becomes “exams are easier”; a fall becomes “students have been treated unfairly”. The truth is more careful. This guide offers A-level grade inflation explained through an A-level results historic comparison, separating changes in assessment from changes in grade boundaries and student performance.
The short answer is that results from 2020 and 2021 should not be compared directly with ordinary exam years. Summer exams were cancelled and grades were awarded through exceptional arrangements. Exams returned in 2022 with transitional grading, while England returned to pre-pandemic grading standards in 2023. The latest published results, from summer 2025, belong to a more comparable post-pandemic system.
The results-day checklist
Before interpreting any headline, ask:
- Is the figure for England or the whole UK?
- Does it describe entries, students or one subject?
- Were grades based on exams or teacher assessment?
- Is the comparison with 2019, the final pre-pandemic exam year?
- Are we discussing grade outcomes or raw-mark boundaries?
That short checklist prevents most misleading conclusions.
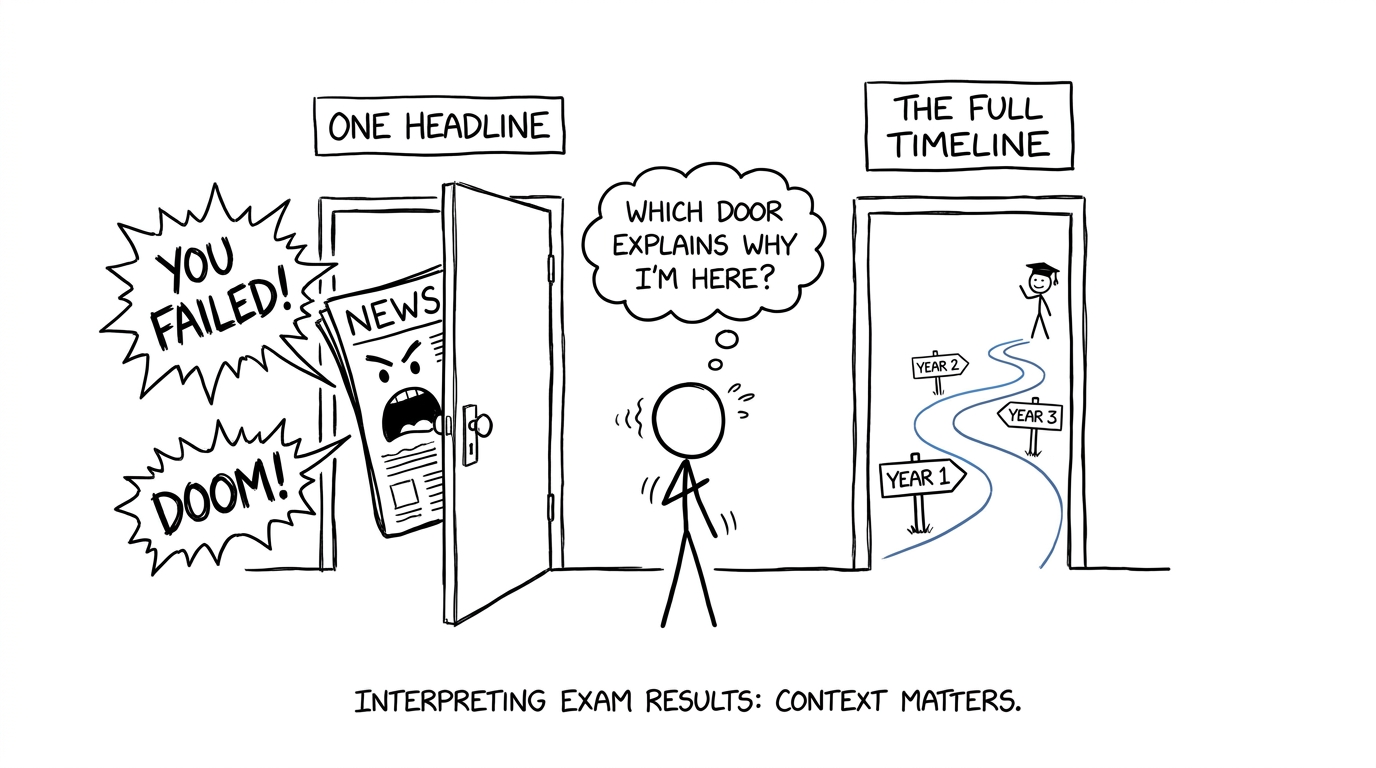 A student choosing between a dramatic headline and the full results timeline
What does A-level grade inflation mean?
Grade inflation describes a sustained rise in the proportion of higher grades without an equivalent rise in the standard of attainment those grades represent. However, a higher percentage of A∗A^*A∗ and AAA grades does not prove inflation by itself.
Outcomes may change because the cohort is different, subject choices have shifted, teaching has improved or assessment arrangements have changed. During the pandemic, the method of awarding grades changed fundamentally. That is why Ofqual identifies 2020 and 2021 as a break in the historical time series.
There is also an important geographical distinction. Ofqual regulates qualifications in England, while Wales and Northern Ireland have their own regulators and policies. JCQ publishes combined UK results, so an England-only figure should not be compared casually with a UK-wide figure.
A-level grading timeline from 2019 to 2025
| Year | Grading approach | How to interpret the results |
|---|---|---|
| 2019 | Summer examinations under pre-pandemic arrangements | The clearest baseline for later historic comparisons |
| 2020 | Exams cancelled; final awards followed exceptional centre-assessment arrangements | Not directly comparable with an ordinary exam year |
| 2021 | Exams cancelled; teacher-assessed grades were used | Exceptional outcomes and another clear break in the series |
| 2022 | Exams returned with grading intended to reflect a midpoint between 2019 and 2021 outcomes | A planned transition year, not a full return to normal |
| 2023 | England returned to pre-pandemic grading standards, with protection for pandemic disruption | Much more comparable with 2019, though context still matters |
| 2024 | Normal examination and grading arrangements continued | Suitable for post-pandemic comparison |
| 2025 | Normal arrangements continued; published summer results remain provisional initially | The latest complete results-day comparison available before summer 2026 |
Ofqual’s official plan was deliberate rather than sudden. The 2022 transition reduced the gap between pandemic outcomes and the pre-pandemic standard. In 2023, senior examiners returned to that earlier standard while using evidence about prior attainment and the quality of students’ work.
What the historic figures show
JCQ’s provisional UK figures show that 28.3%28.3\%28.3% of A-level entries received A∗A^*A∗ or AAA in 2025, compared with 25.4%25.4\%25.4% in 2019. The 2025 proportion receiving A∗A^*A∗ was 9.4%9.4\%9.4%, compared with 7.7%7.7\%7.7% in 2019.
These figures show that top-grade outcomes were higher than before the pandemic. They do not, alone, identify the cause. A sound interpretation should consider changes in entries, subjects, cohort attainment and the evidence used by examiners to maintain standards.
Pandemic-era outcomes were much further from the 2019 pattern. The highest results arrived in 2021, when teacher-assessed grades replaced summer examinations. Results then moved down in 2022 during the transition and closer to the pre-pandemic profile in 2023.
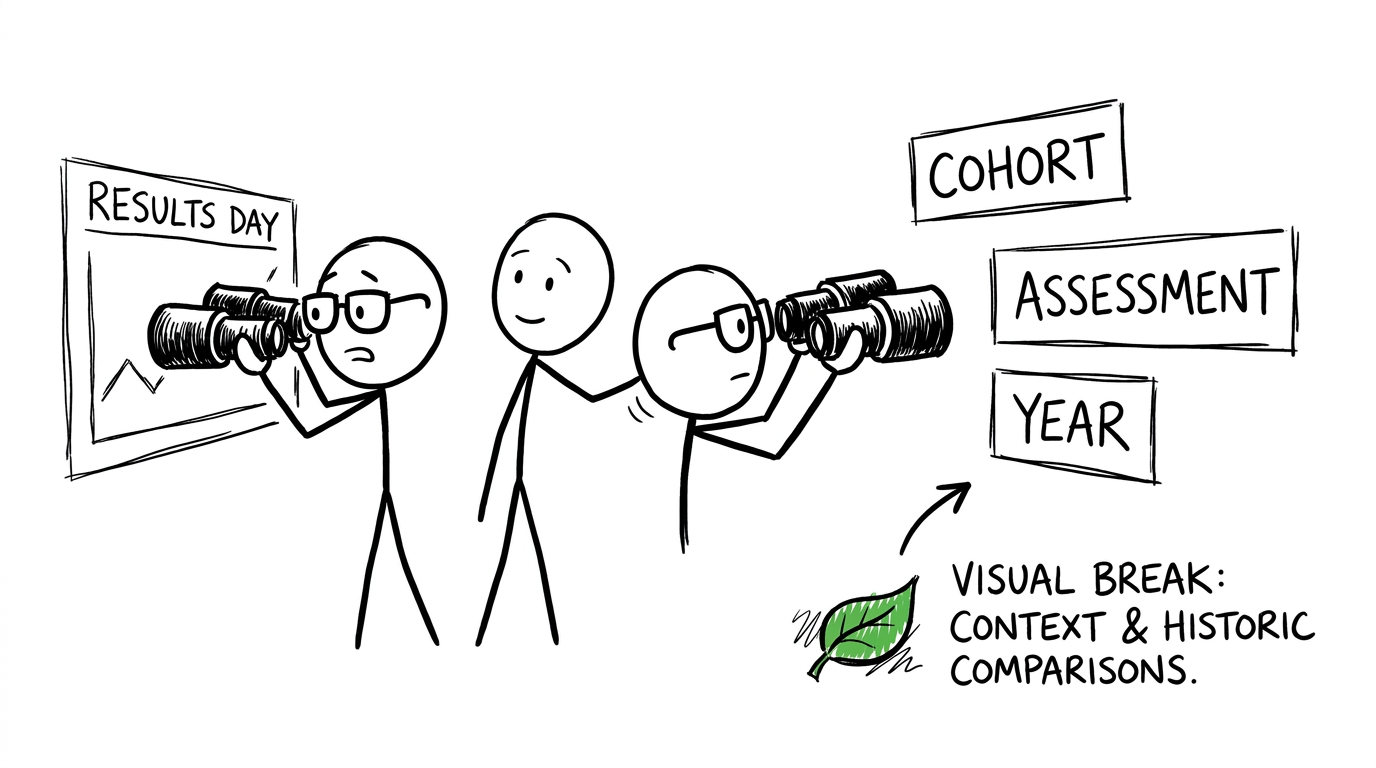 A parent turning the results-day binoculars towards cohort and assessment context
Grade outcomes are not grade boundaries
A grade outcome is the proportion of entries receiving a particular grade. A grade boundary is the minimum raw mark needed for that grade on a specific specification and exam series.
Boundaries can rise when a paper is more accessible and fall when it is more demanding. This helps preserve a comparable standard. It does not mean exam boards simply decide in advance that a fixed percentage must receive each grade; Ofqual has explicitly stated that there is no predetermined quota.
Maths makes this distinction especially visible. The Edexcel A-level Maths grade-boundary history shows boundaries changing between exam series, while the OCR A-level Maths grade-boundary history follows a different specification. Students can also explore the wider GCSE, IGCSE and A-level grade-boundary archive.
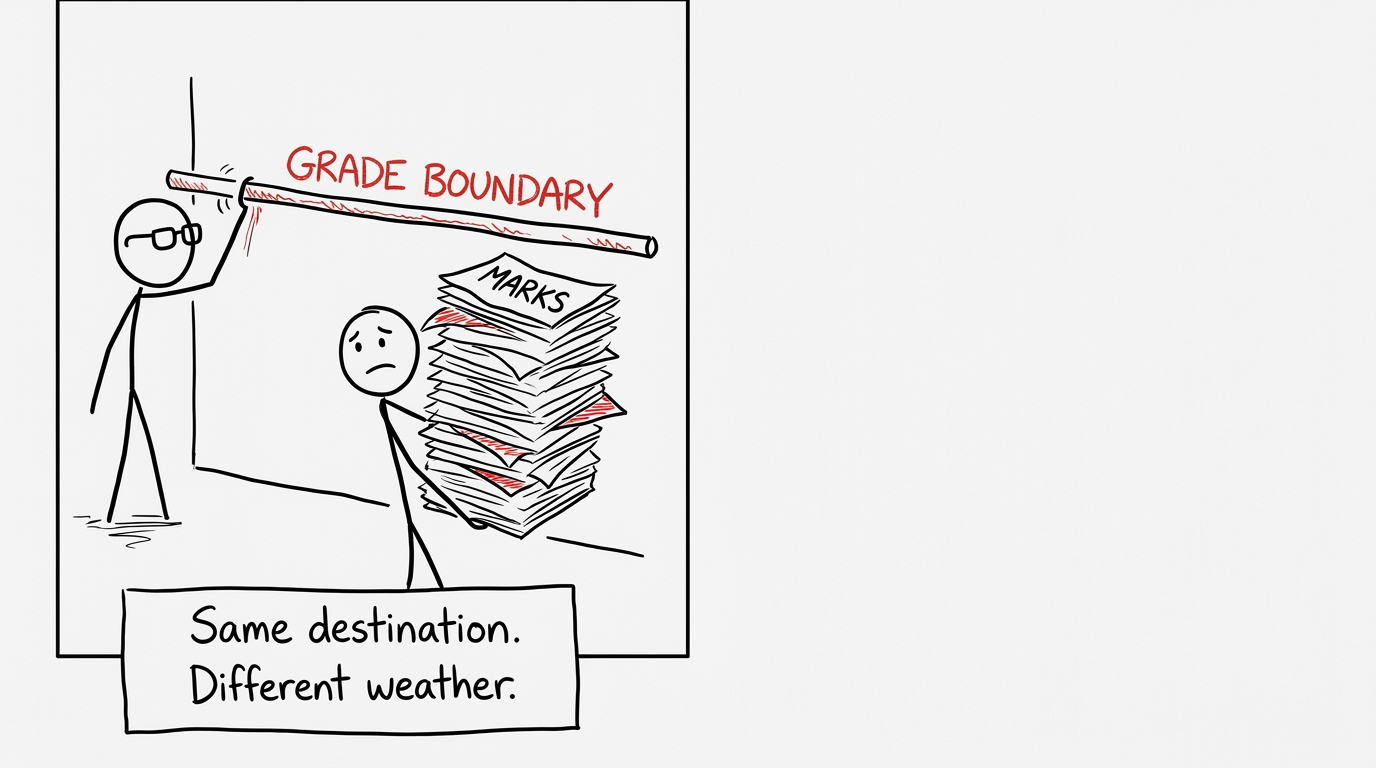 An examiner adjusting a grade-boundary limbo bar as a student carries marks
What this means for GCSE students
For a GCSE student considering A-level Maths, historic percentages should provide context, not a prediction. Your eventual grade will depend on your performance against the standard applied to your specification and exam series.
The useful response is practical. Build secure GCSE algebra, graphs, geometry and statistics through the GCSE Maths revision hub. If you are taking Edexcel, the Edexcel GCSE Maths revision page combines lessons, exam-style questions, worksheets and papers for foundation and higher tier.
Students already looking ahead can explore Edexcel A-level Maths revision, including pure maths, statistics and mechanics resources. Historic boundaries can help you understand past results, but revision lessons and repeated practice are what improve your marks.
Common mistakes when comparing A-level results
Treating 2020 and 2021 as normal exam years
They used exceptional assessment arrangements. Comparisons with examined cohorts need an explicit warning.
Mixing England and UK statistics
Check the geographical coverage before placing figures side by side. Different nations can use different grading policies.
Assuming a higher boundary means a harder standard
A higher raw-mark boundary may indicate that the paper was more accessible. Difficulty and grading standard are related, but they are not identical.
Using boundaries as predictions
Future boundaries are unknown until awarding has taken place. Predicted papers are revision tools, not forecasts of exact marks. Use GCSE predicted papers alongside past papers rather than treating either as a guarantee.
Read the timeline, then return to the work
The fairest historic comparison starts with 2019, marks 2020 and 2021 as exceptional, recognises 2022 as transitional, and treats 2023 onwards as the return to pre-pandemic grading standards in England. Even then, national outcomes describe cohorts rather than individual potential.
Use MathsGenie to turn that context into action. Begin with revision lessons and practice questions, test yourself with mini tests, then move to past papers, mark schemes, video solutions and predicted papers. For a structured routine, follow the GCSE one-month maths revision plan. And when results arrive, return to MathsGenie’s grade-boundary history pages before drawing conclusions from a headline.










