The Maxwell–Boltzmann distribution curves for a fixed amount of gas at two different temperatures, T1 T_1\,T1 and T2T_2T2 (T2>T1T_2 > T_1T2>T1), are shown in the diagram below.
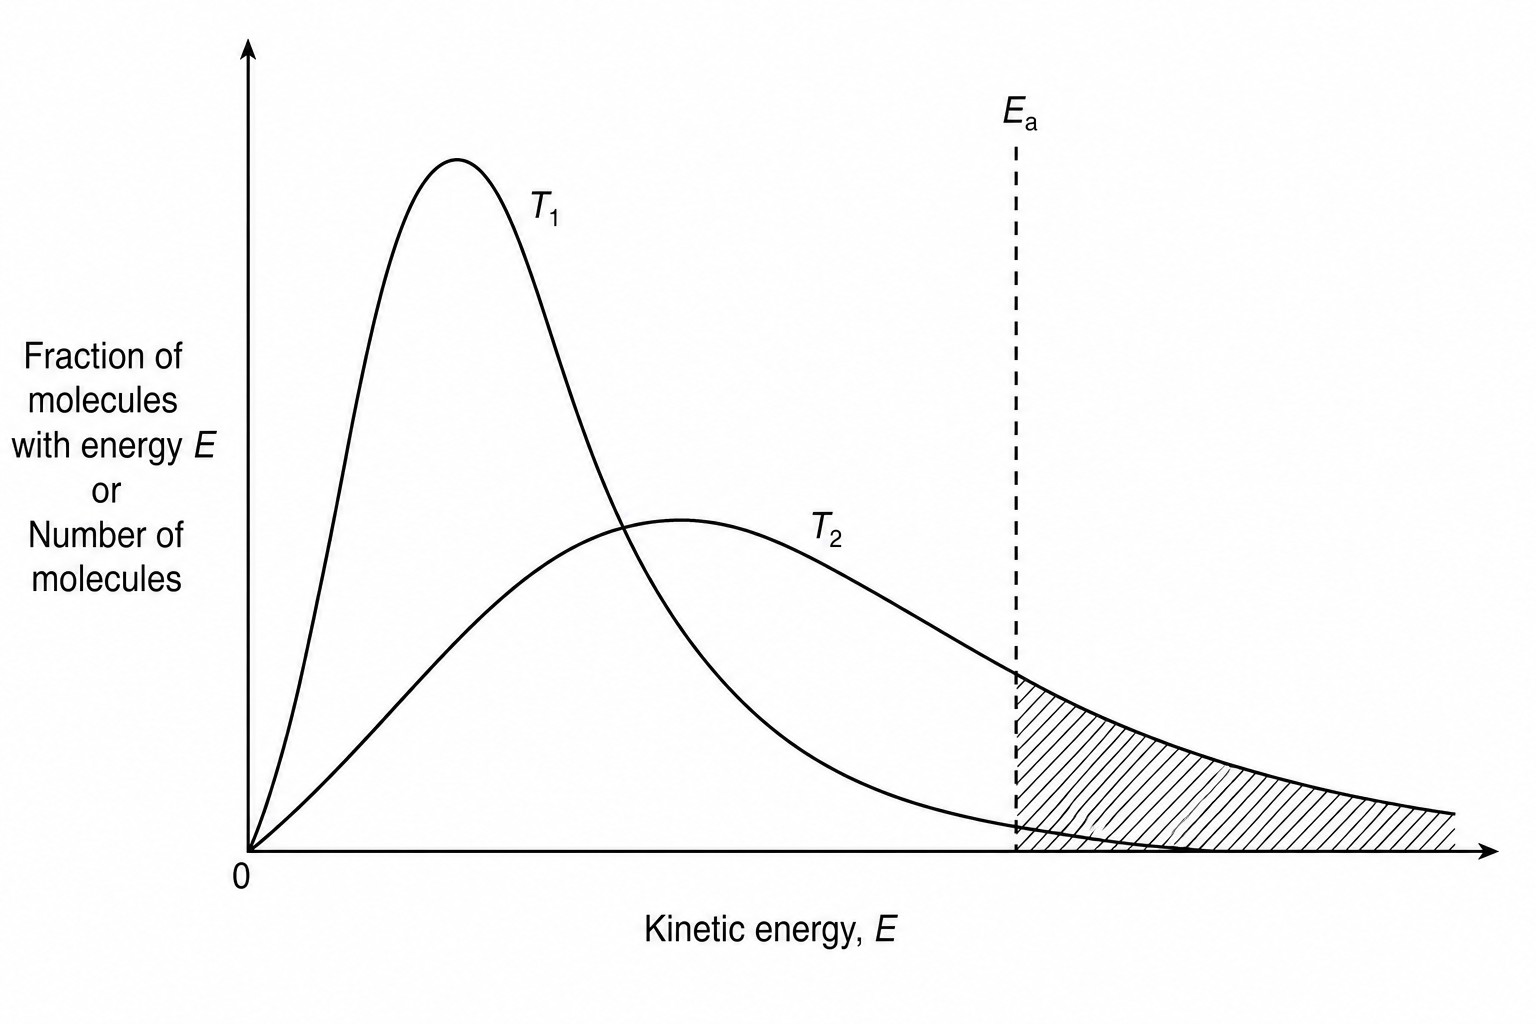
Which statement correctly explains why the reaction rate is significantly greater at T2 T_2\,T2 than at T1T_1T1?
The activation energy, EaE_{\text{a}}Ea, decreases as temperature increases, allowing a larger fraction of molecules to react.
The total area under the curve increases at T2T_2T2, reflecting a significant increase in the total number of particles in the system.
The fraction of molecules with energy greater than or equal to EaE_{\text{a}}Ea is significantly larger, leading to a much higher proportion of successful collisions.
The peak of the curve shifts to the right and becomes higher, representing a decrease in the most probable kinetic energy of the molecules.