The Maxwell–Boltzmann distribution curve is shown for a gaseous reaction mixture. An activation energy, EaE_{\text{a}}Ea, is marked on the horizontal axis.
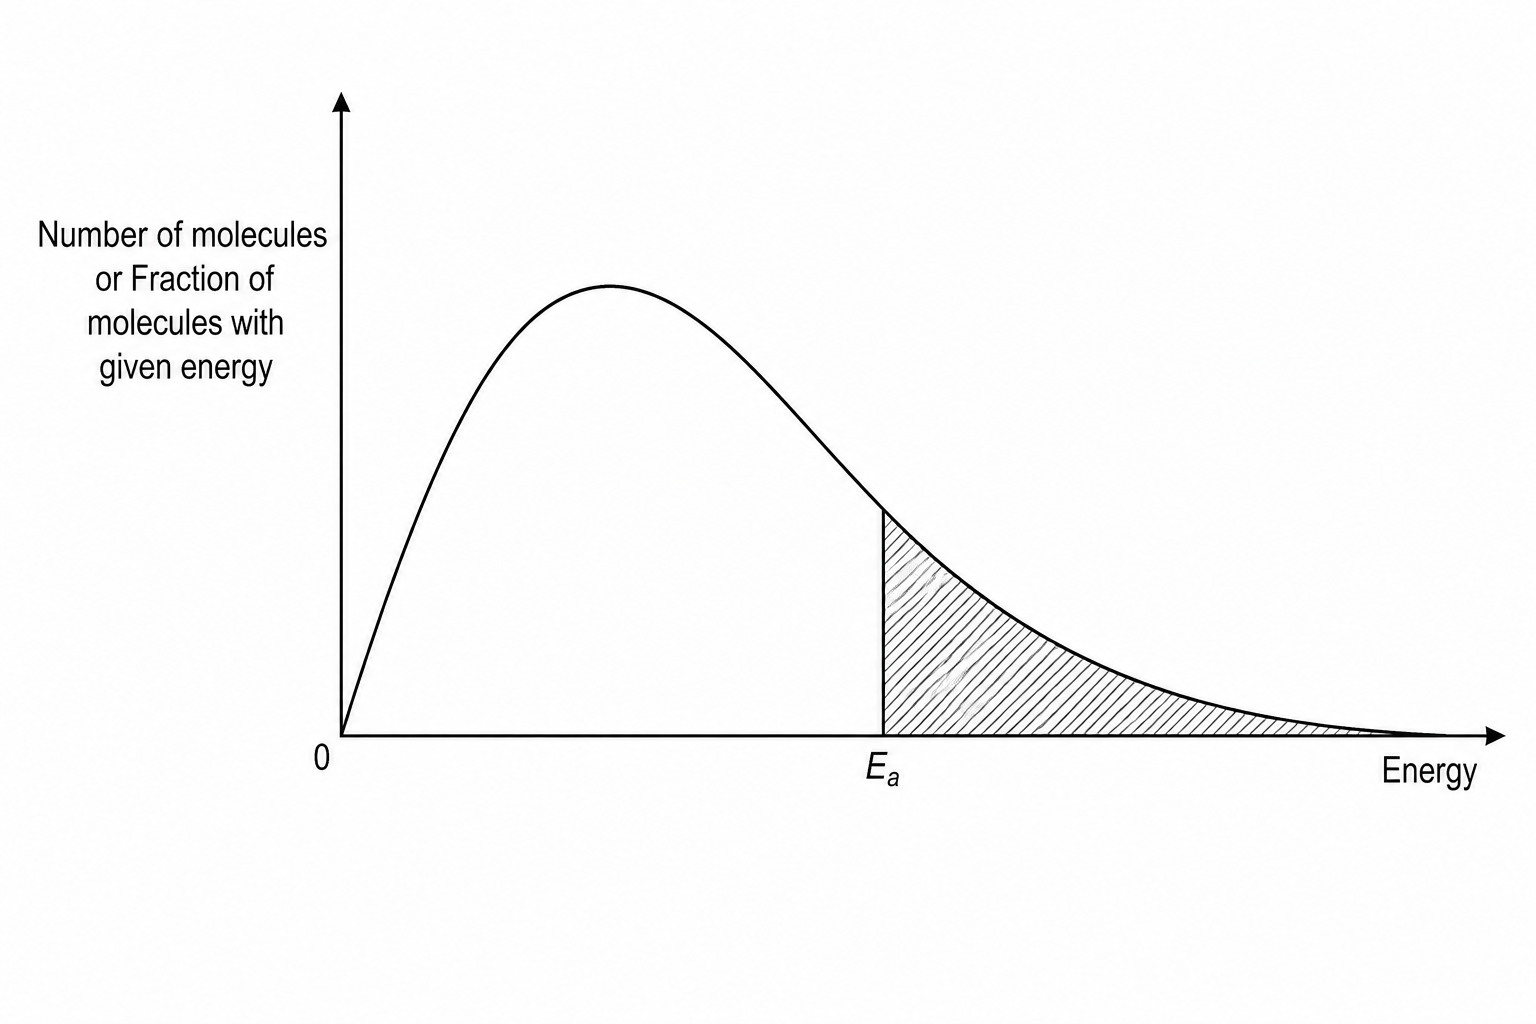
What is represented by the shaded area under the curve to the right of EaE_{\text{a}}Ea?
The total energy of the molecules with energy greater than EaE_{\text{a}}Ea
The total number of molecules in the reaction mixture
The number of molecules with energy greater than or equal to the activation energy
The rate constant of the reaction