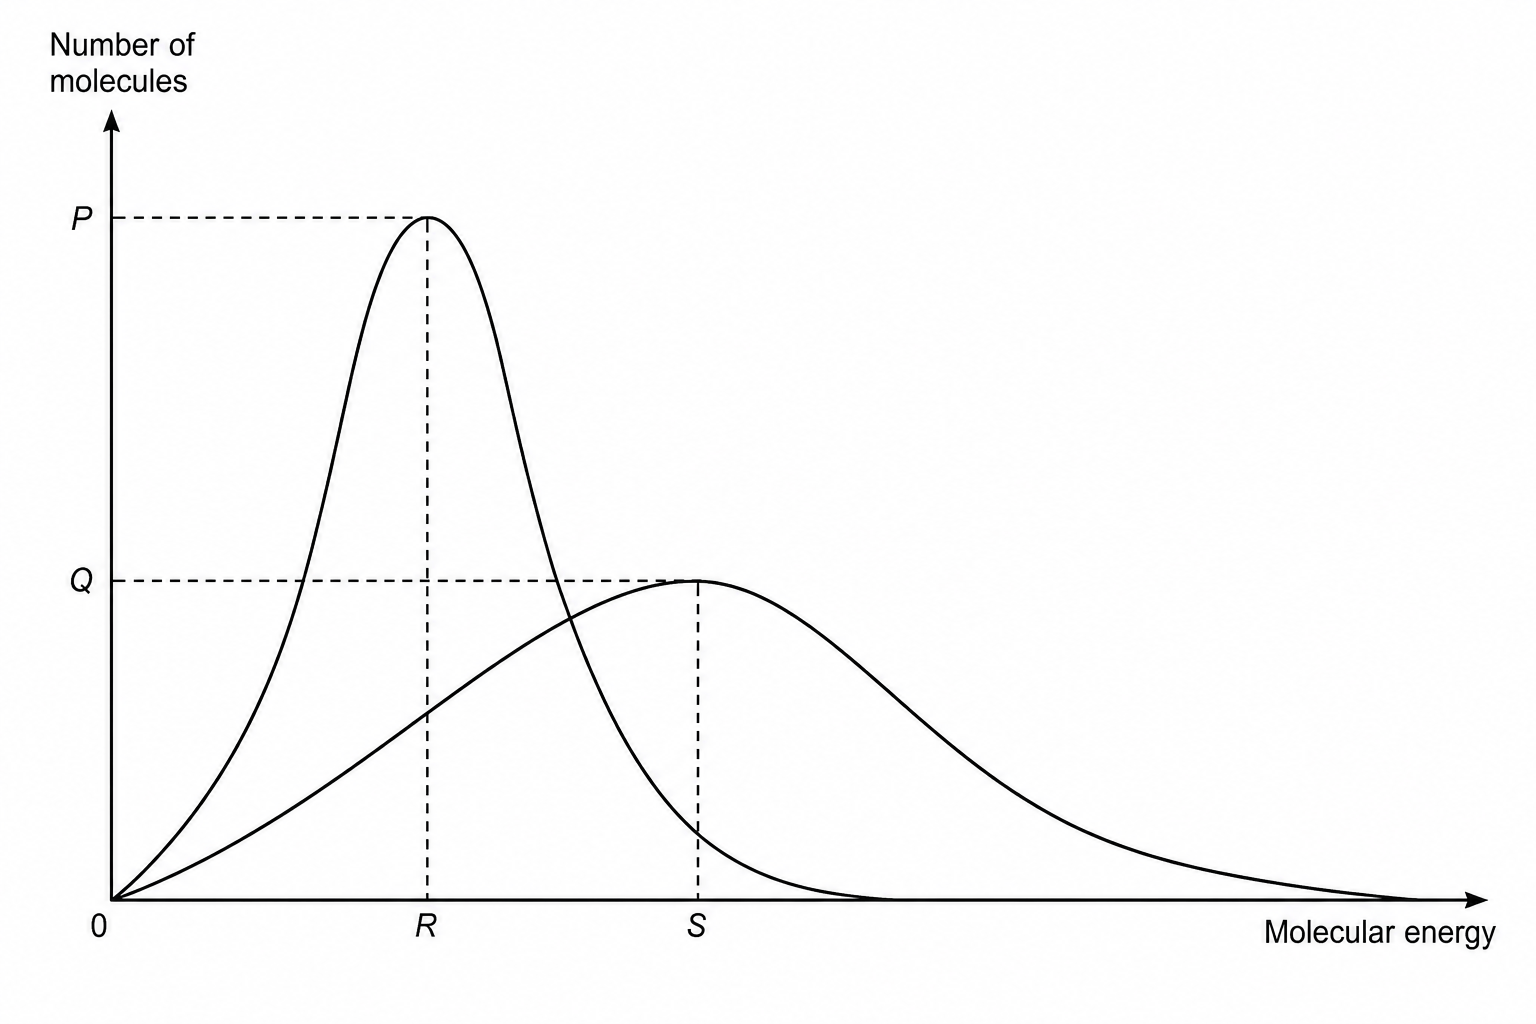
The diagram shows the Maxwell–Boltzmann distribution of molecular energies in a gas at two different temperatures.
Which letter represents the most probable energy of the molecules at the lower temperature?
PPP
QQQ
RRR
SSS