A fixed mass of an ideal gas is heated from temperature T1 T_1\,T1 to temperature T2T_2T2. The diagram below shows the Maxwell–Boltzmann distribution curves for the gas at these two temperatures, where EaE_{\text{a}}Ea represents the activation energy of a reaction.
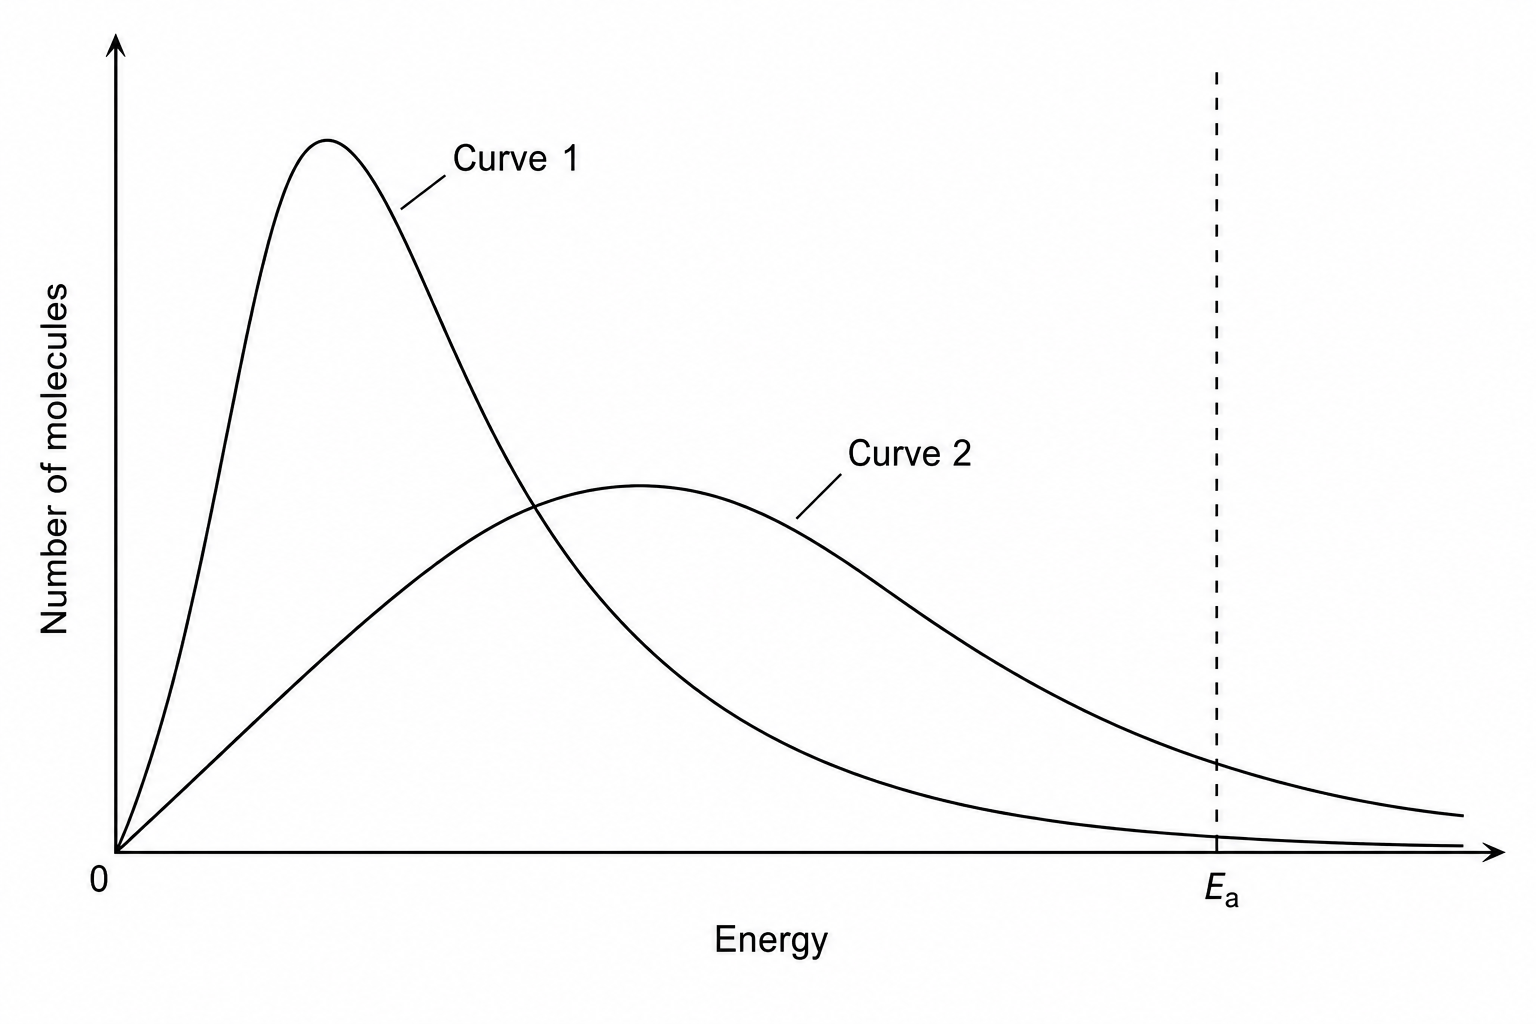
Which of the following statements is correct?
Curve 1 corresponds to T2T_2T2, Curve 2 corresponds to T1T_1T1, and the total area under Curve 2 is greater than that under Curve 1.
Curve 1 corresponds to T1T_1T1, Curve 2 corresponds to T2T_2T2, and the fraction of molecules with energy greater than EaE_{\text{a}}Ea is larger at T2T_2T2.
Curve 1 corresponds to T1T_1T1, Curve 2 corresponds to T2T_2T2, and the most probable molecular energy is lower at T2T_2T2.
Curve 1 corresponds to T2T_2T2, Curve 2 corresponds to T1T_1T1, and the number of molecules with energy greater than EaE_{\text{a}}Ea is larger at T1T_1T1.