The Maxwell–Boltzmann distribution curves for a sample of gaseous reactants at two different temperatures, T1 T_1\,T1 and T2T_2T2 (T2>T1T_2 > T_1T2>T1), are shown below.
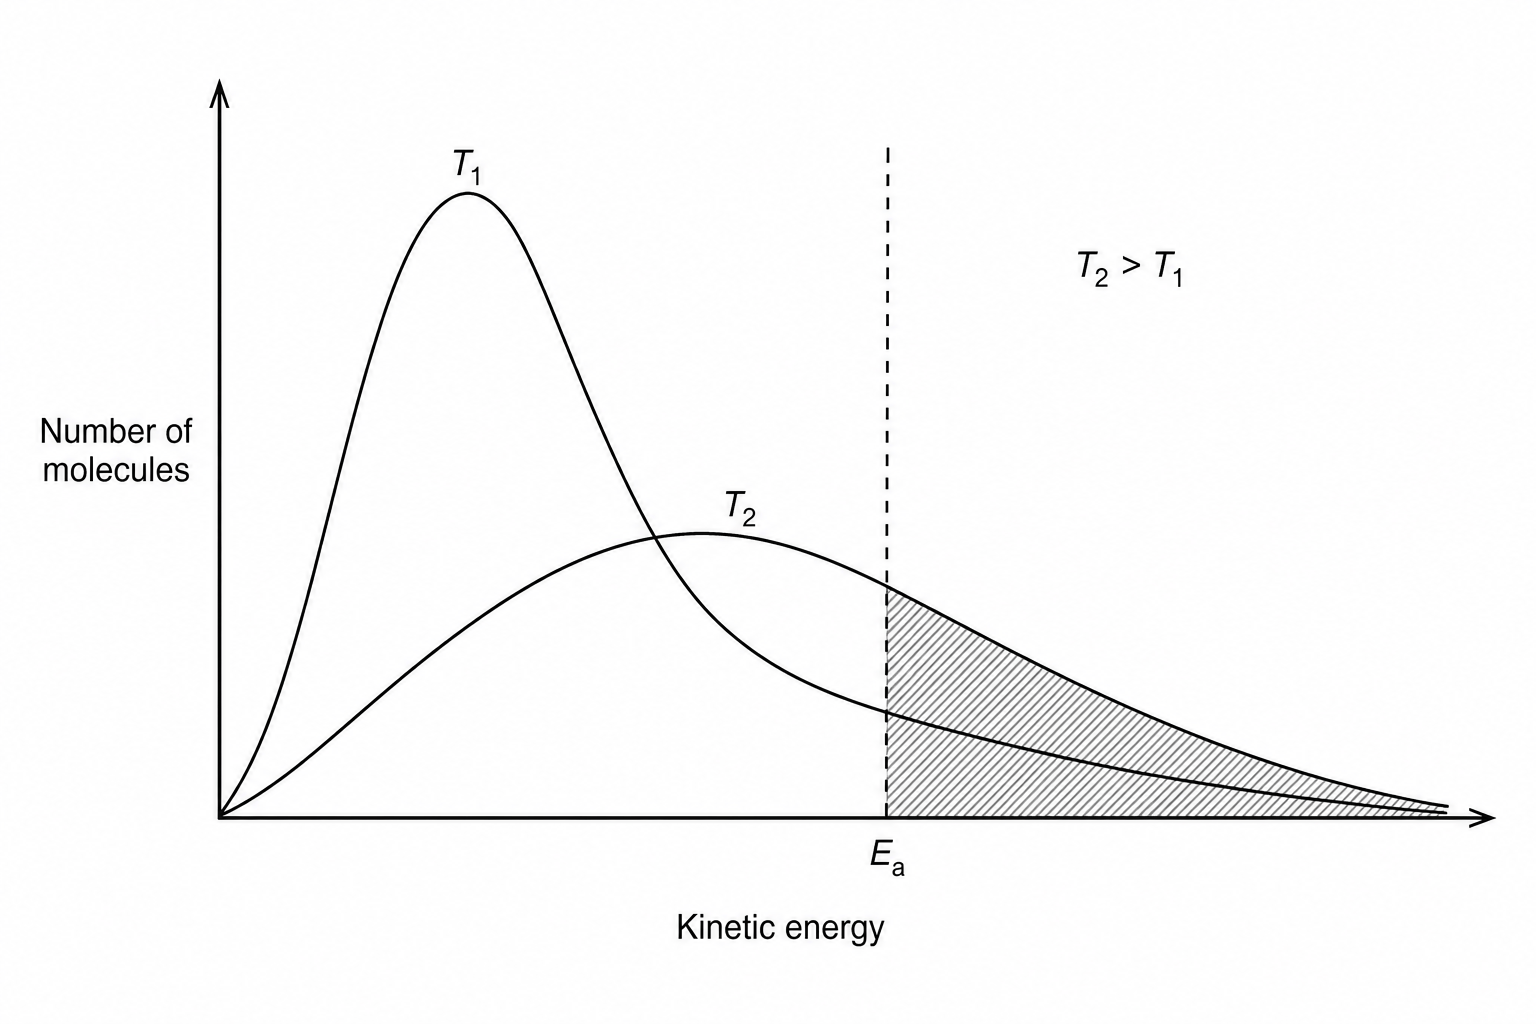
Which statement correctly describes the changes that occur when the temperature of this reaction mixture is increased from T1 T_1\,T1 to T2T_2T2?
The total area under the curve remains constant, EaE_aEa remains unchanged, and the proportion of collisions with energy greater than or equal to EaE_aEa increases.
The total area under the curve remains constant, EaE_aEa shifts to the left, and the proportion of successful collisions increases.
The total area under the curve decreases as the peak height lowers, EaE_aEa remains unchanged, and the collision frequency decreases.
The total area under the curve increases as the average energy of the molecules increases, EaE_aEa shifts to the right, and the rate of reaction increases.