The graph shows a Maxwell–Boltzmann distribution of molecular energies for a sample of gas at a constant temperature.
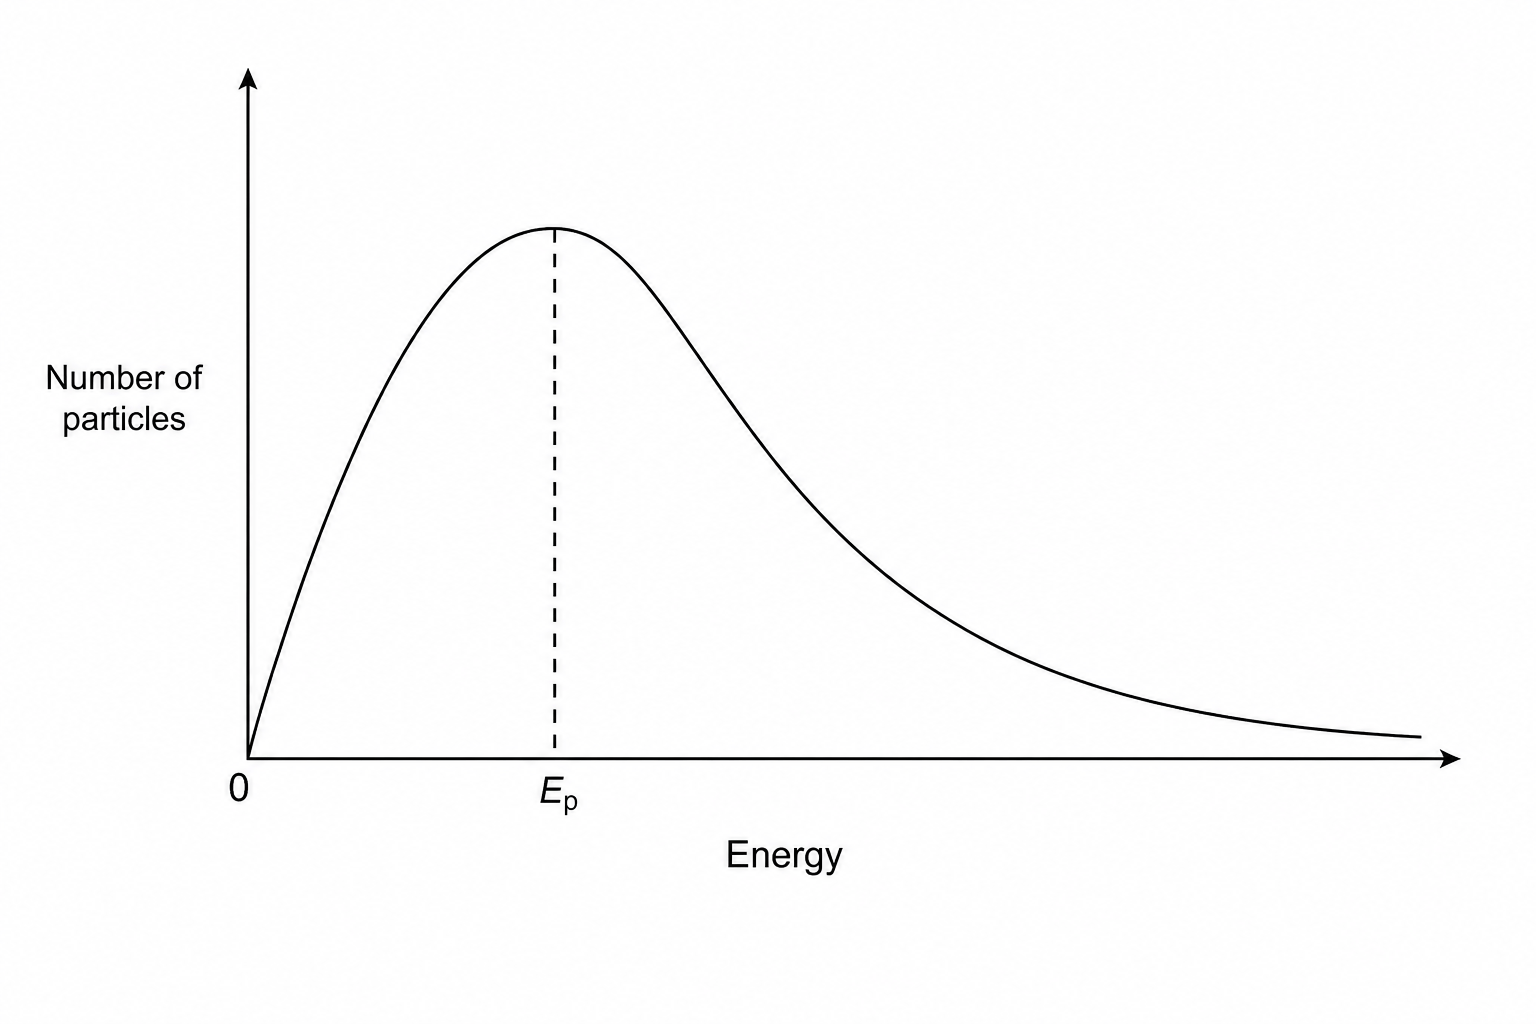
What is represented by the energy value Ep E_p\,Ep corresponding to the peak of the curve?
The activation energy of the reaction
The mean energy of the particles
The most probable energy of the particles
The total kinetic energy of all particles