The diagram shows the Maxwell–Boltzmann distribution of molecular energies in a gas sample at two different temperatures, T1 T_1\,T1 and T2T_2T2 (T2>T1T_2 > T_1T2>T1).
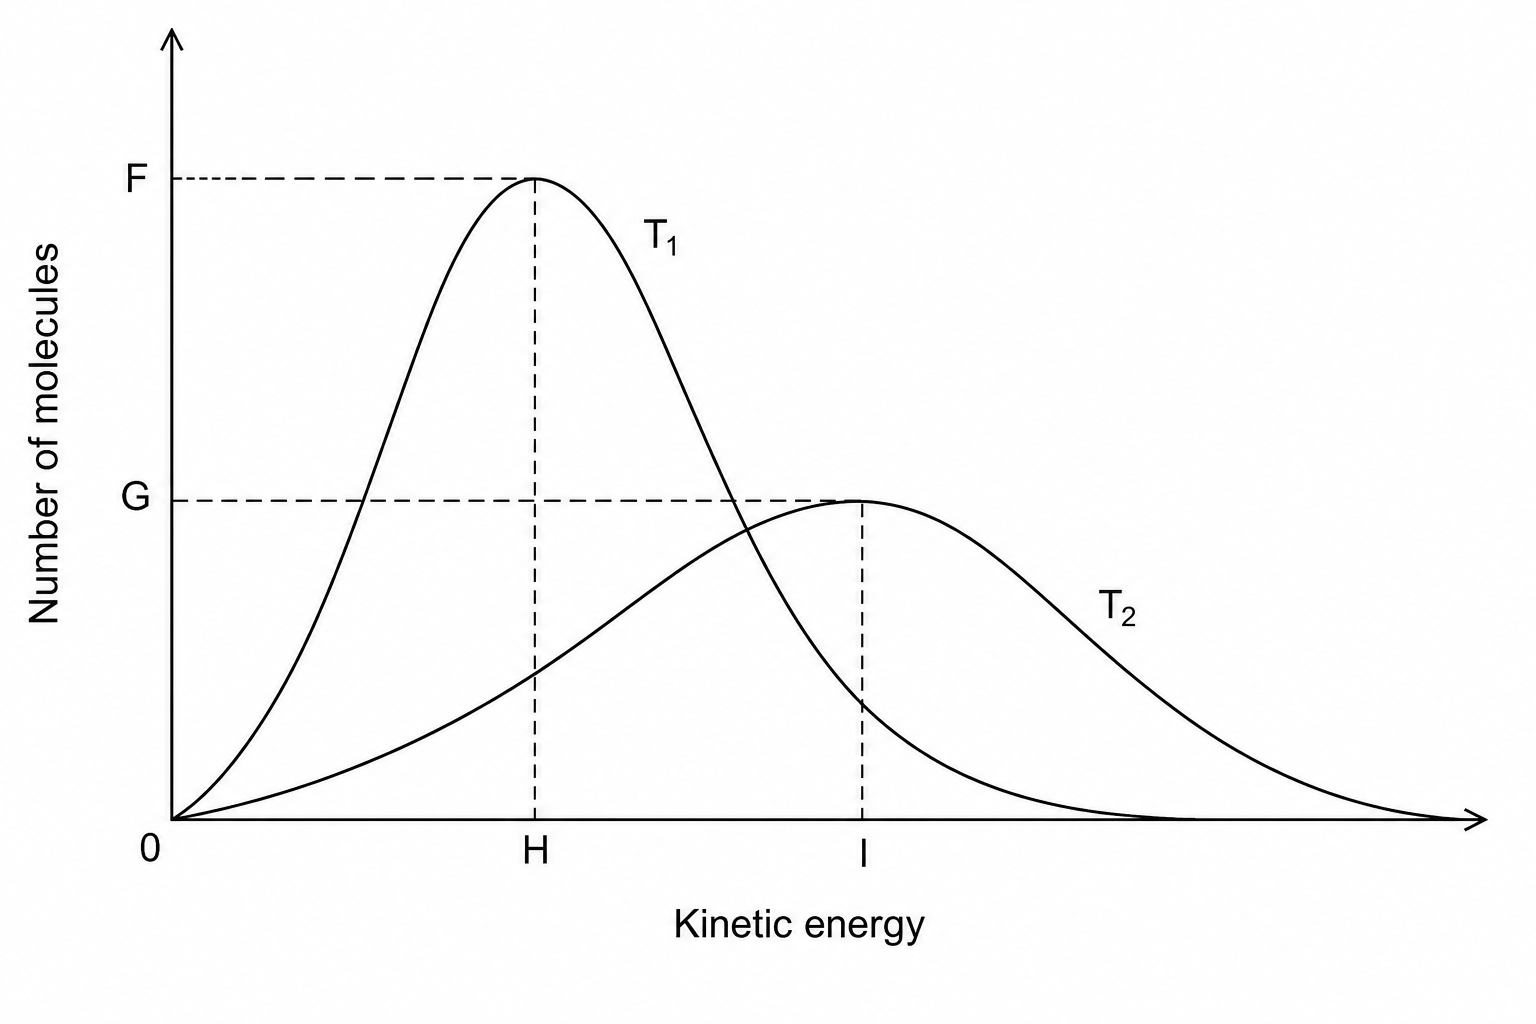
Which letter represents the number of molecules with the most probable energy at the higher temperature?
FFF
GGG
HHH
III