The graph below shows the ratio of solute concentration in the tubule fluid (TFTFTF) to its concentration in blood plasma (PPP) along the different regions of a healthy mammalian nephron.
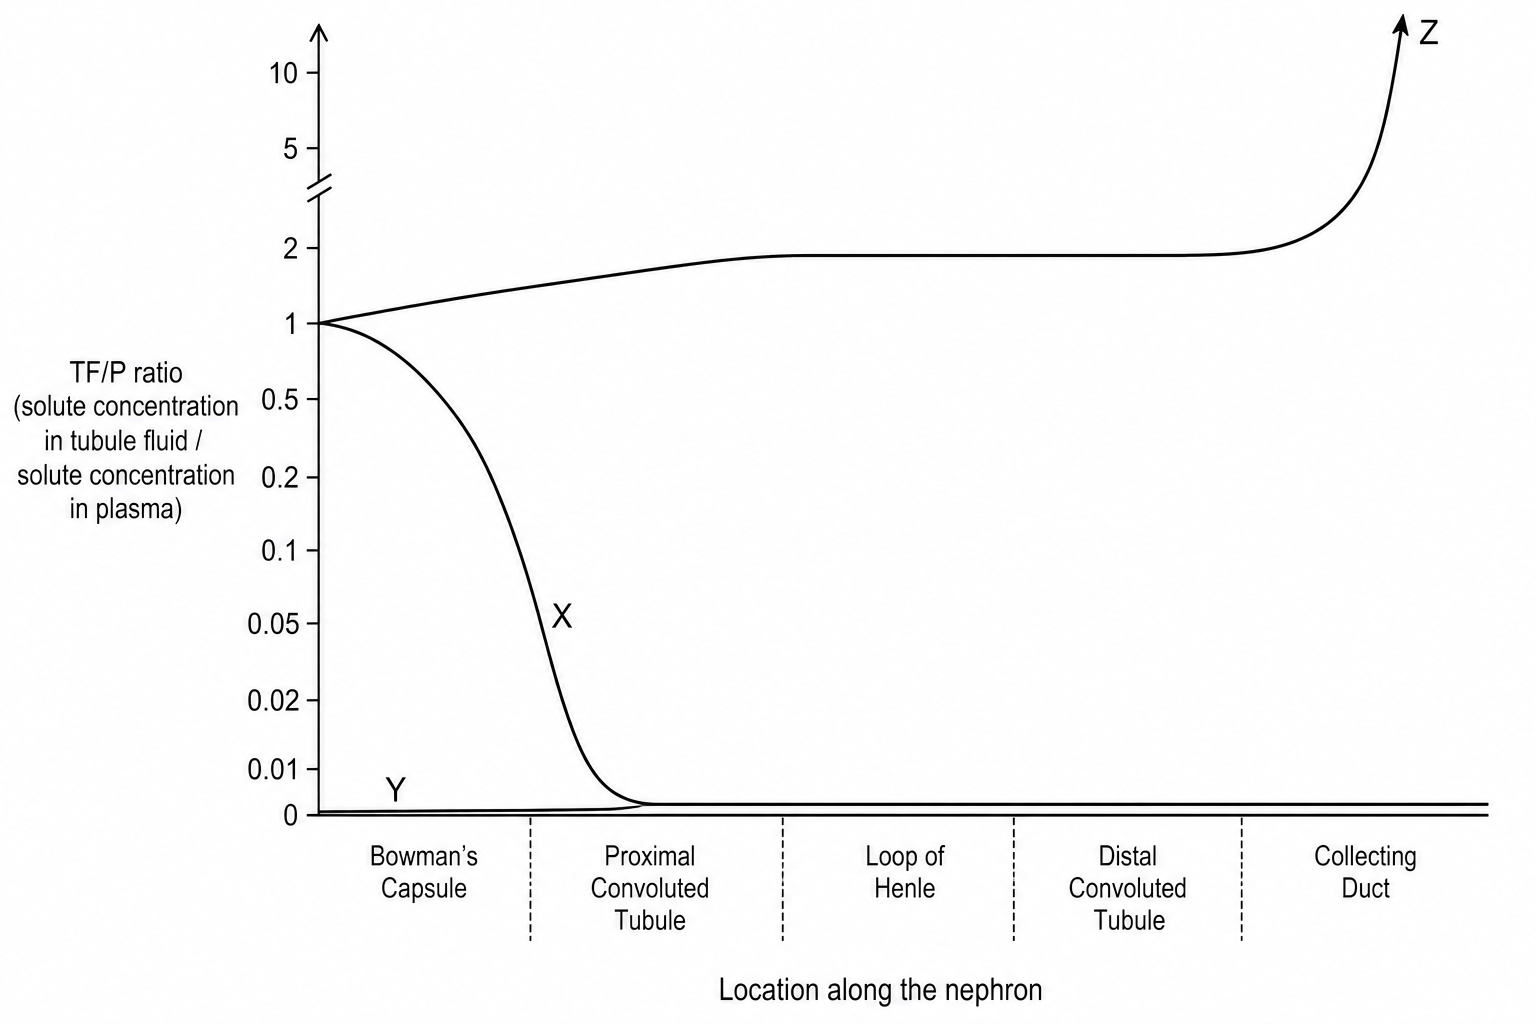
Which of the following options correctly identifies the substances represented by curves X, Y, and Z, and describes how an increase in blood water potential (hydration) would affect curve Z in the collecting duct?
X: Glucose; Y: Albumin; Z: Urea. An increase in blood water potential decreases ADH secretion, reducing water reabsorption in the collecting duct and lowering the peak of curve Z.
X: Glucose; Y: Albumin; Z: Urea. An increase in blood water potential increases ADH secretion, increasing water reabsorption in the collecting duct and raising the peak of curve Z.
X: Albumin; Y: Glucose; Z: Urea. An increase in blood water potential decreases ADH secretion, reducing water reabsorption in the collecting duct and lowering the peak of curve Z.
X: Urea; Y: Albumin; Z: Glucose. An increase in blood water potential increases ADH secretion, reducing water reabsorption in the collecting duct and raising the peak of curve Z.