A student uses an oscilloscope to measure the frequency of a signal. The diagram shows the waveform displayed on the grid screen.
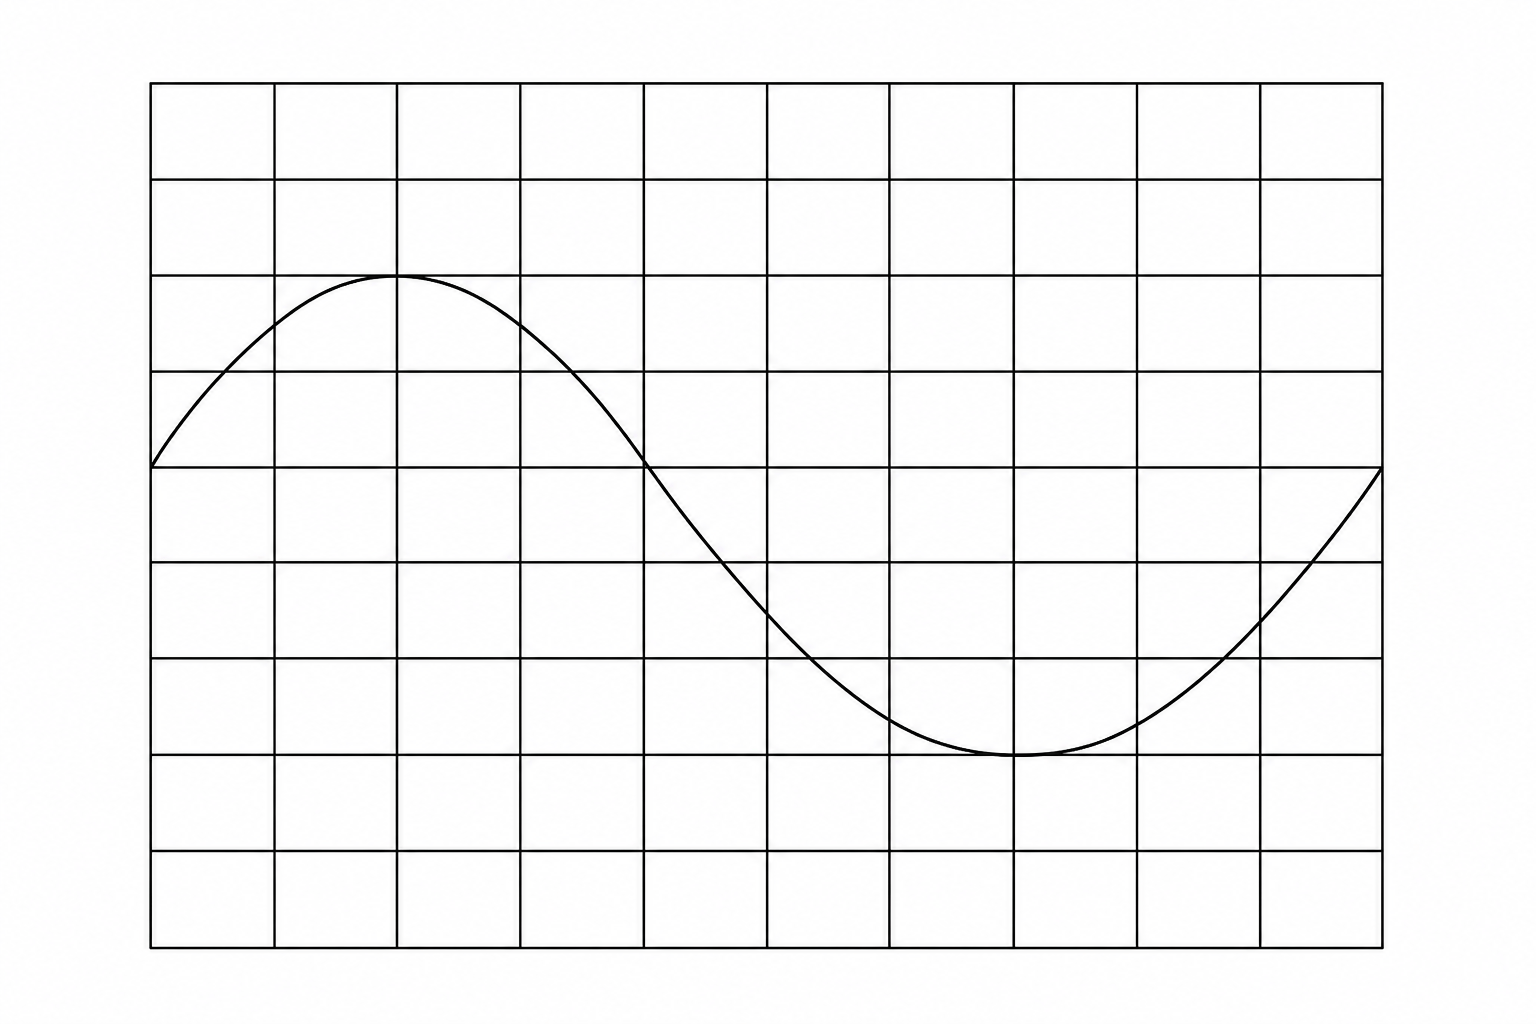
The time-base setting of the oscilloscope is 40 μs/div40\ \mu\text{s}/\text{div}40 μs/div.
What is the frequency of the signal?
2.5 kHz2.5\text{ kHz}2.5 kHz
5.0 kHz5.0\text{ kHz}5.0 kHz
25 kHz25\text{ kHz}25 kHz
400 Hz400\text{ Hz}400 Hz