Motion

EasyMedium
123456789101112131415161718192021222324252627282930313233343536373839404142434445464748495051525354
Question 50
Medium

A person walks their dog from home to a local park. The distance–time graph of their journey is shown below.
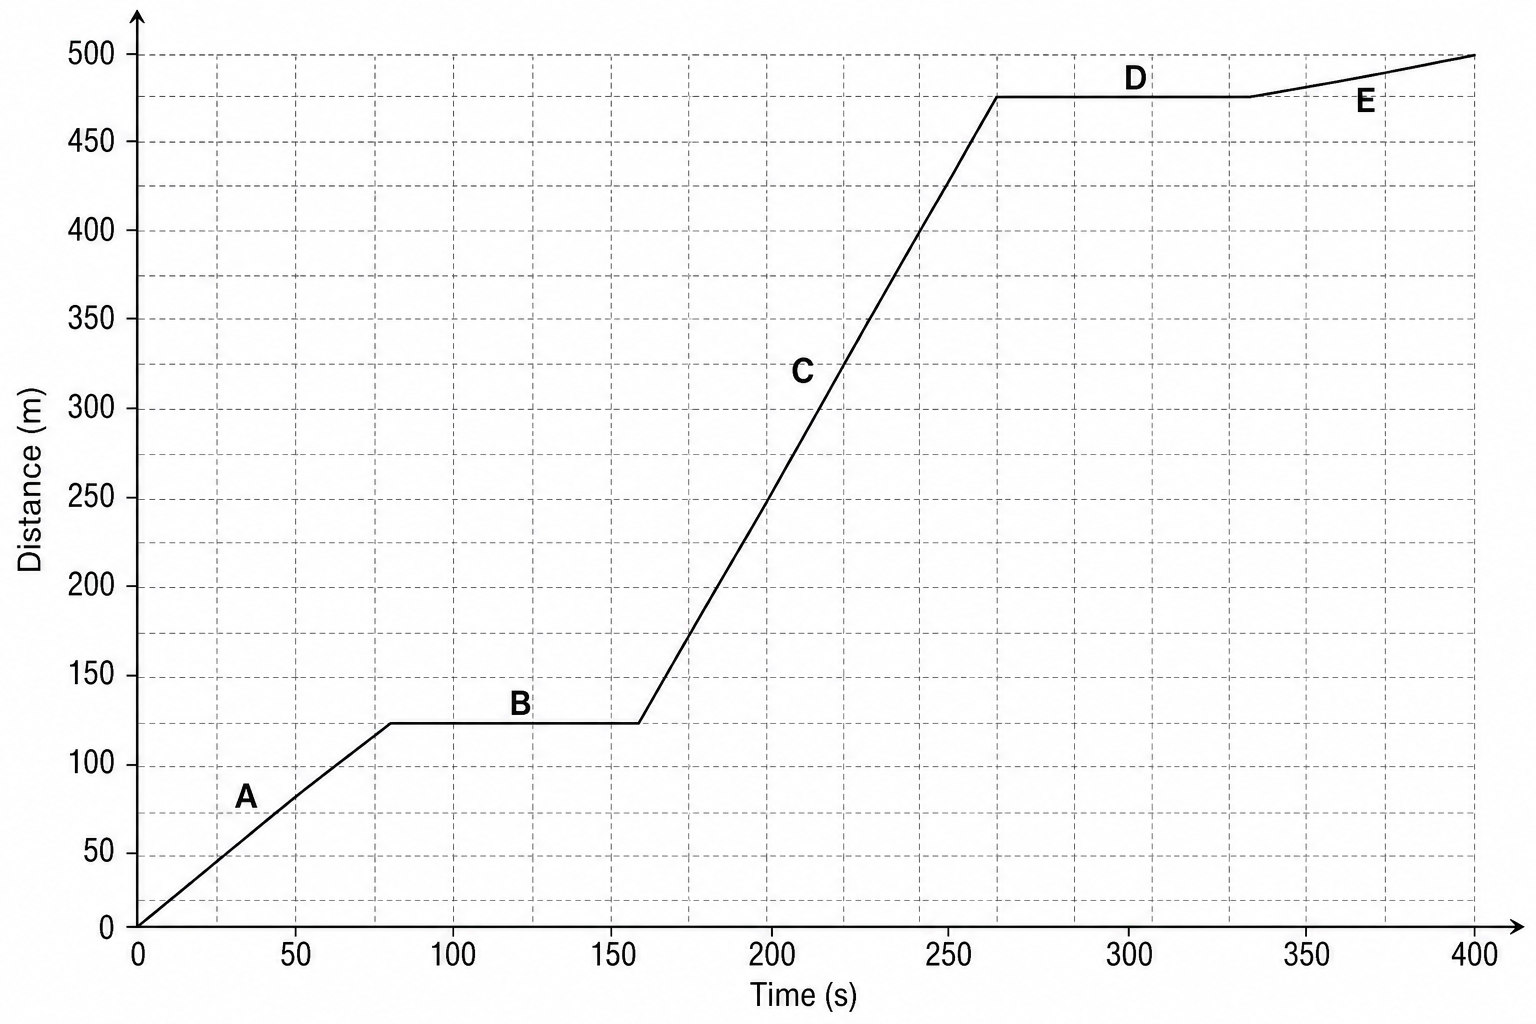
![A distance-time graph showing the journey of a person walking their dog. The vertical axis is labeled 'Distance (m)' and ranges from 0 to 500 m, with grid lines every 10 units. The horizontal axis is labeled 'Time (s)' and ranges from 0 to 400 s, with grid lines every 10 units. The graph has five straight-line segments labeled A, B, C, D, and E:

  • Section A: a straight line rising from (0, 0) to (80, 120).
  • Section B: a horizontal line from (80, 120) to (140, 120).
  • Section C: a steep straight line rising from (140, 120) to (260, 480).
  • Section D: a horizontal line from (260, 480) to (320, 480).
  • Section E: a gently sloped straight line rising from (320, 480) to (400, 500).](https://assets.mathsgenie.co.uk/aqa-qb/09ea1c27-cb51-4a06-8460-6bffcec1b2fa.png)
a.

State the total distance travelled by the person.

[1]
b.

State the total time the journey took.

[1]
c.

Calculate the person's average speed during their journey.

[2]
d.

State which section of the journey, A–E, is where the person travels the fastest. Explain your answer.

[2]
e.

Suggest what happens at sections B and D on the journey.

[1]
f.

Suggest appropriate equipment the person could use to measure the time and the distance of their journey.

[2]

Motion Questions

  1. GCSE
  2. /Physics
  3. /Motion