An autonomous delivery rover on a test track detects an obstacle ahead. The velocity–time graph below shows how its velocity changes from the moment the sensors detect the obstacle at t=0 st = 0\text{ s}t=0 s.
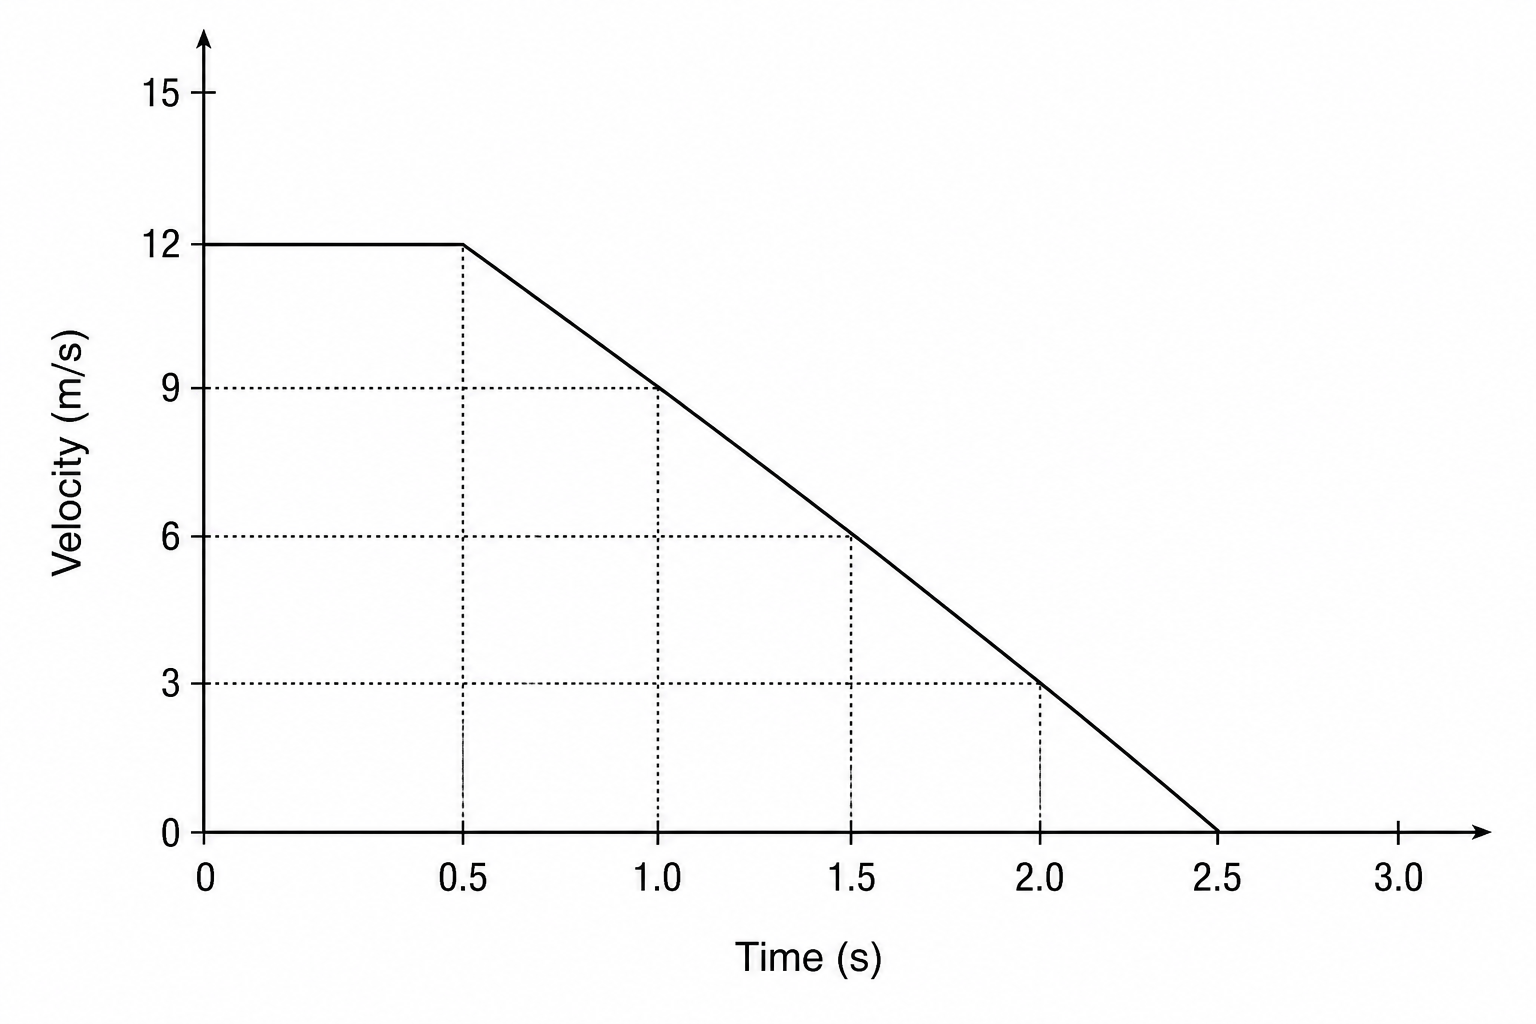
What is the braking distance of the rover?
6.0 m6.0\text{ m}6.0 m
12.0 m12.0\text{ m}12.0 m
15.0 m15.0\text{ m}15.0 m
18.0 m18.0\text{ m}18.0 m