Heating, specific heat and latent heat

EasyMediumHard
12345678910111213141516171819202122232425262728293031323334353637383940414243444546
Question 33
Easy

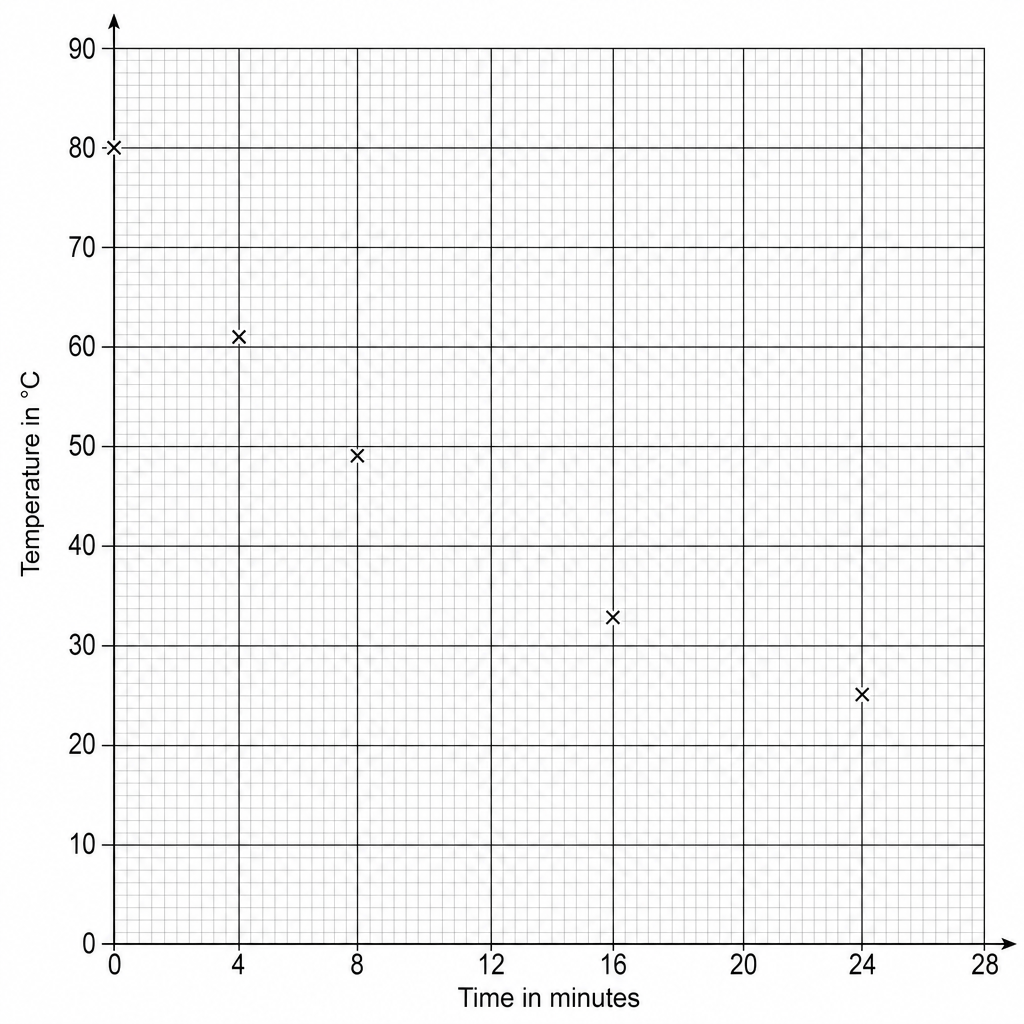
A student investigates how the temperature of liquid paraffin decreases as it cools in a glass beaker.

The temperature of the liquid paraffin is recorded every 4 minutes.

Table 1 shows the results.

Table 1

Time in minutesTemperature in ∘C^\circ\text{C}∘C
080
461
849
12 (not yet plotted)40
1633
20 (not yet plotted)28
2425

Plot these two remaining points on the graph shown in Figure 1. Figure 1: A graph grid representing the cooling of liquid paraffin over time. The vertical axis is labeled 'Temperature in ^\circ\text{C}' and ranges from 0 to 90 with major grid lines every 10 units, subdivided into smaller squares representing 1 ^\circ\text{C} each. The horizontal axis is labeled 'Time in minutes' and ranges from 0 to 28 with major grid lines every 4 units, subdivided into smaller squares representing 0.4 minutes each. Plotted crosses 'x' are shown at coordinates (0, 80), (4, 61), (8, 49), (16, 33), and (24, 25).
[2]

Heating, specific heat and latent heat Questions

  1. GCSE
  2. /Physics
  3. /Heating, specific heat and latent heat