Question 23
FThe Figure shows how energy is transferred out of a house on a cold day.
Figure
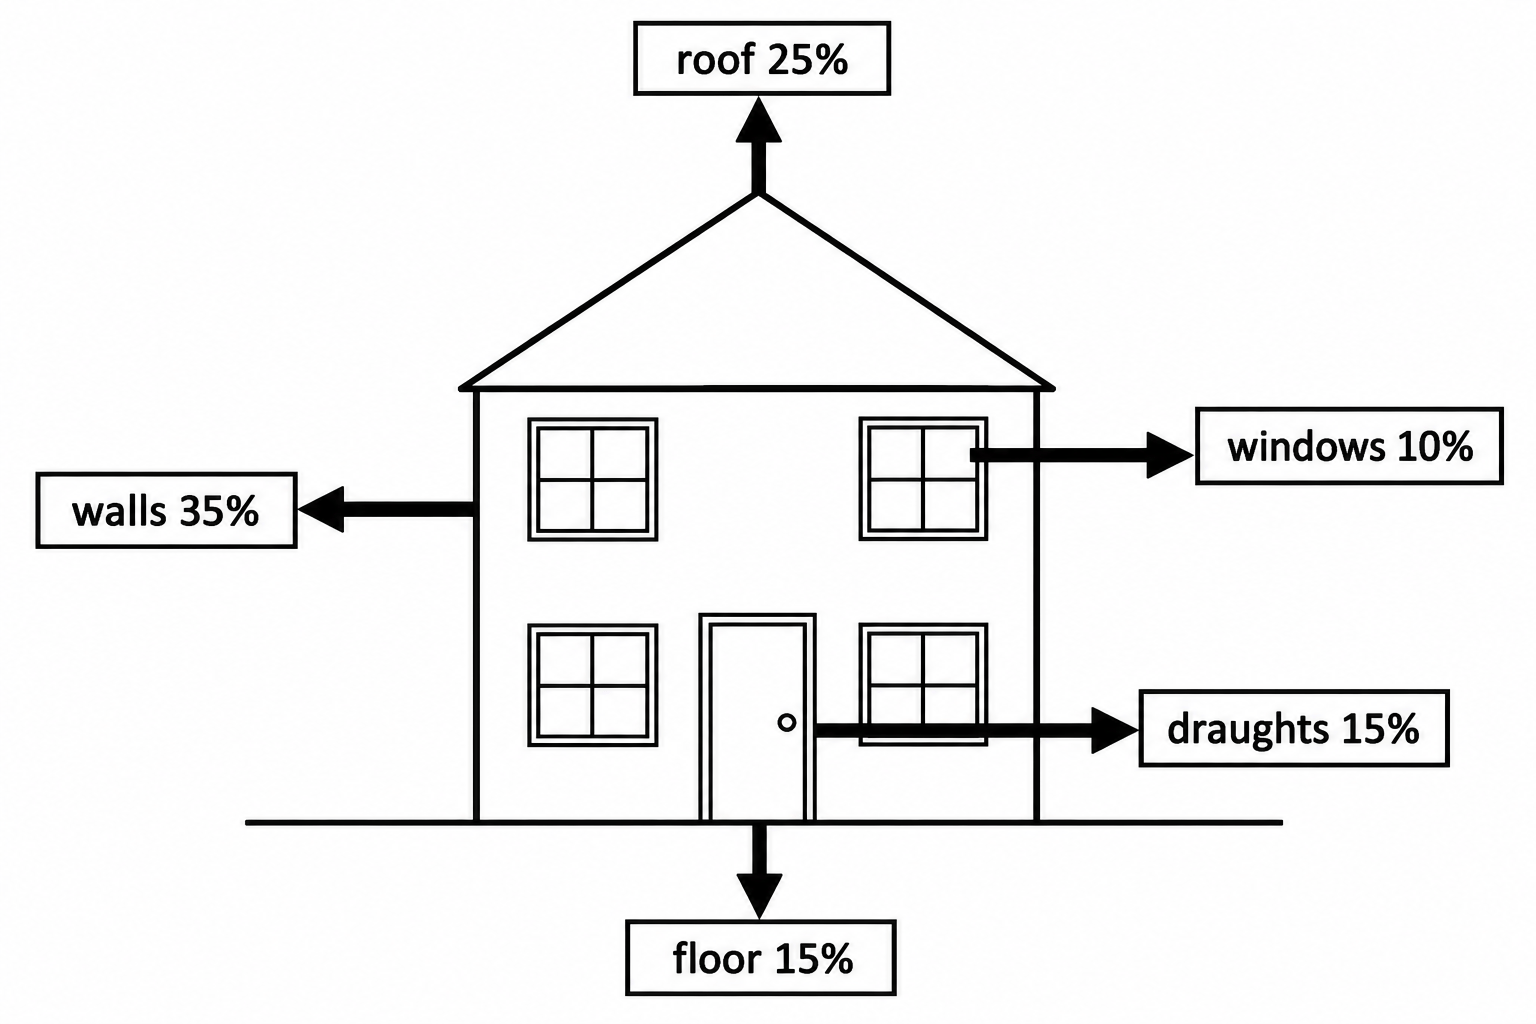
The Table shows the cost and the yearly saving for some ways of reducing energy transfer from the house.
Table
| Improvement | Cost in £ | Saving each year in £ |
|---|---|---|
| loft insulation | 400 | 160 |
| cavity wall insulation | 900 | 225 |
| double glazing | 5000 | 100 |
| draught excluders | 60 | 40 |
a.[1]
Use the Figure to state where most energy is transferred out of the house.
b.[2]
The payback time is the time taken for the savings to equal the cost.
payback time=costsaving each year\text{payback time} = \dfrac{\text{cost}}{\text{saving each year}}payback time=saving each yearcost
Calculate the payback time for cavity wall insulation.
c.[2]
Explain how cavity wall insulation reduces the rate of energy transfer through the walls.
d.[3]
The owner of the house can only pay for one improvement this year.
Evaluate which improvement the owner should choose.
Use data from the Figure and the Table in your answer.
14.2 Specific heat capacity and latent heat Questions
110 exam-style questions on Edexcel GCSE Physics 14.2 Specific heat capacity and latent heat, covering 14.2.1 Heating, temperature and changes of state, 14.2.2 Specific heat capacity and specific latent heat, 14.2.3 Specific heat capacity calculation, 14.2.4 Specific latent heat calculation, and 14.2.5 Reducing energy transfer through thermal insulation. Each one has a worked solution and a mark scheme showing where the marks go.