Forces and motion

EasyMediumHard
12345678910111213141516171819202122232425262728293031323334353637383940414243444546474849505152535455565758596061626364
Question 43
Medium

An experimental scientific capsule is dropped from a stationary research balloon.

The graph below shows the vertical distance the capsule falls during the first 10 seconds10\text{ seconds}10 seconds after release.
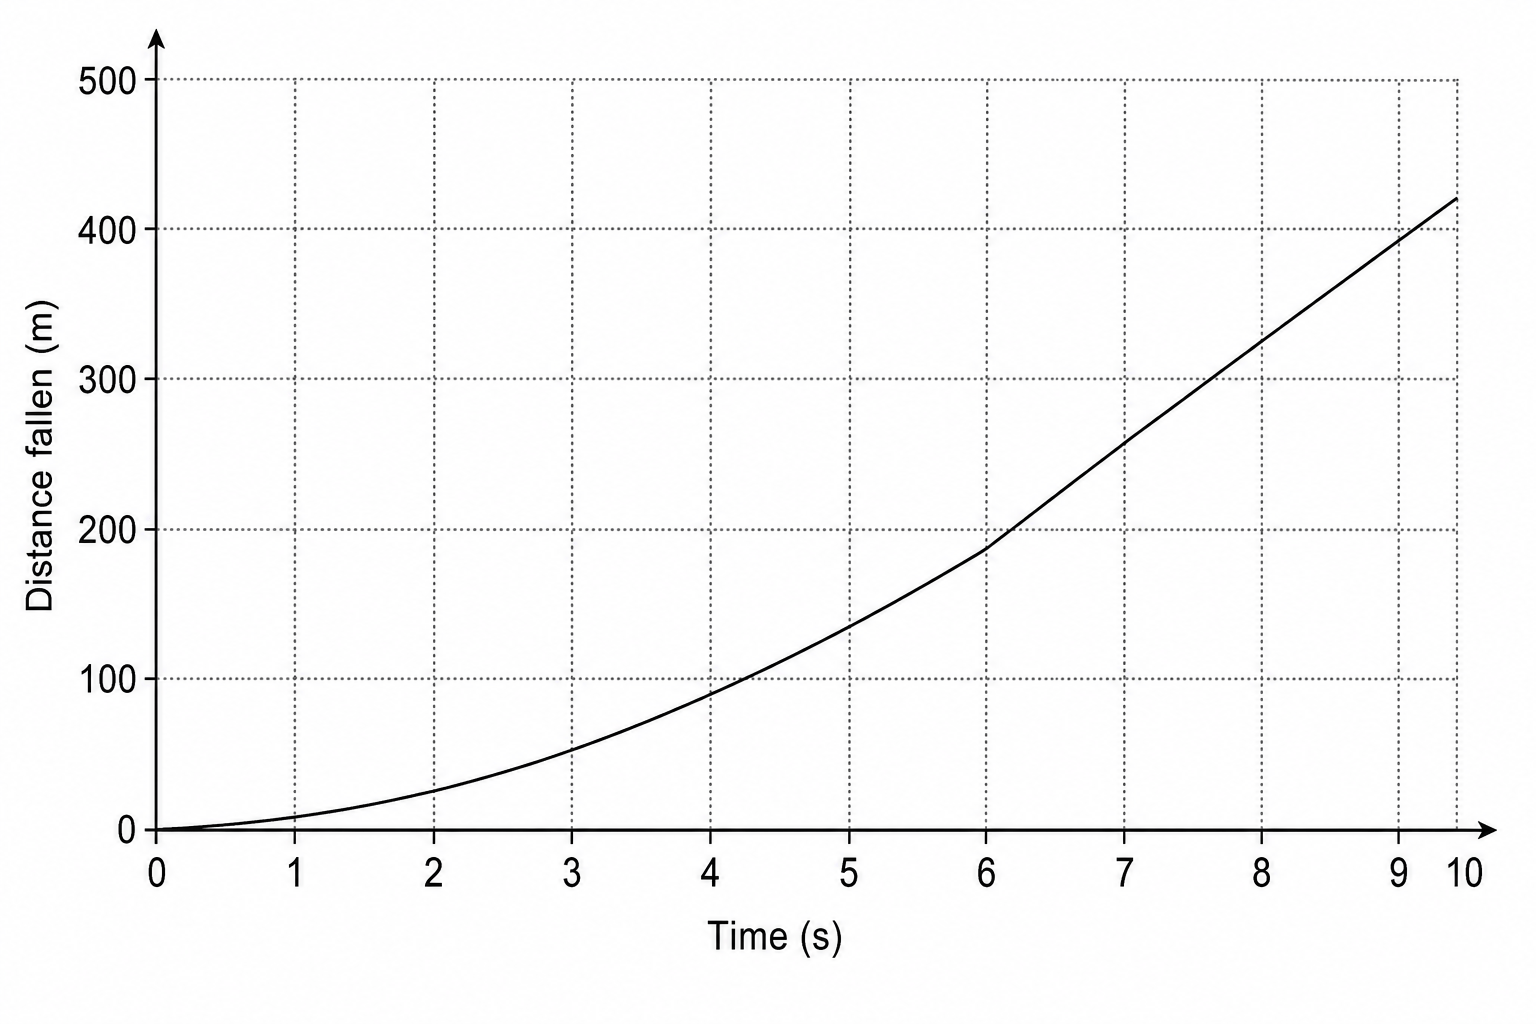
A graph showing distance fallen in metres on the vertical y-axis against time in seconds on the horizontal x-axis. The y-axis ranges from 0 to 500 with major grid lines every 100 units, and finer subdivisions every 10 units. The x-axis ranges from 0 to 10 seconds with major grid lines every 1 second and finer subdivisions every 0.1 seconds. A curved line starts at (0,0), curves upwards with an increasing gradient, and becomes a perfectly straight line from the point (6, 180) to the point (10, 420).

Determine the constant speed of the capsule between 6 seconds6\text{ seconds}6 seconds and 10 seconds10\text{ seconds}10 seconds after release.

[3]

Forces and motion Questions

  1. GCSE
  2. /Physics
  3. /Forces and motion