Question 4
HA student reacts magnesium ribbon with dilute hydrochloric acid and collects the hydrogen in a 100 cm3\mathrm{cm^{3}}cm3 gas syringe.
Mg+2HCl→MgCl2+H2 \mathrm{Mg} + 2\mathrm{HCl} \rightarrow \mathrm{MgCl_{2}} + \mathrm{H_{2}} Mg+2HCl→MgCl2+H2The student uses 0.0972 g of magnesium and 20.0 cm3\mathrm{cm^{3}}cm3 of hydrochloric acid with a concentration of 1.00 mol/dm3\mathrm{mol/dm^{3}}mol/dm3.
Relative atomic mass (Ar): Mg = 24.3
All gas volumes are measured at room temperature and pressure.
a.[3]
Show that the hydrochloric acid is in excess.
b.[2]
Calculate the maximum volume of hydrogen that can be made.
Volume = ...... cm3\mathrm{cm^{3}}cm3
c.[2]
The diagram shows the apparatus at the end of the experiment.
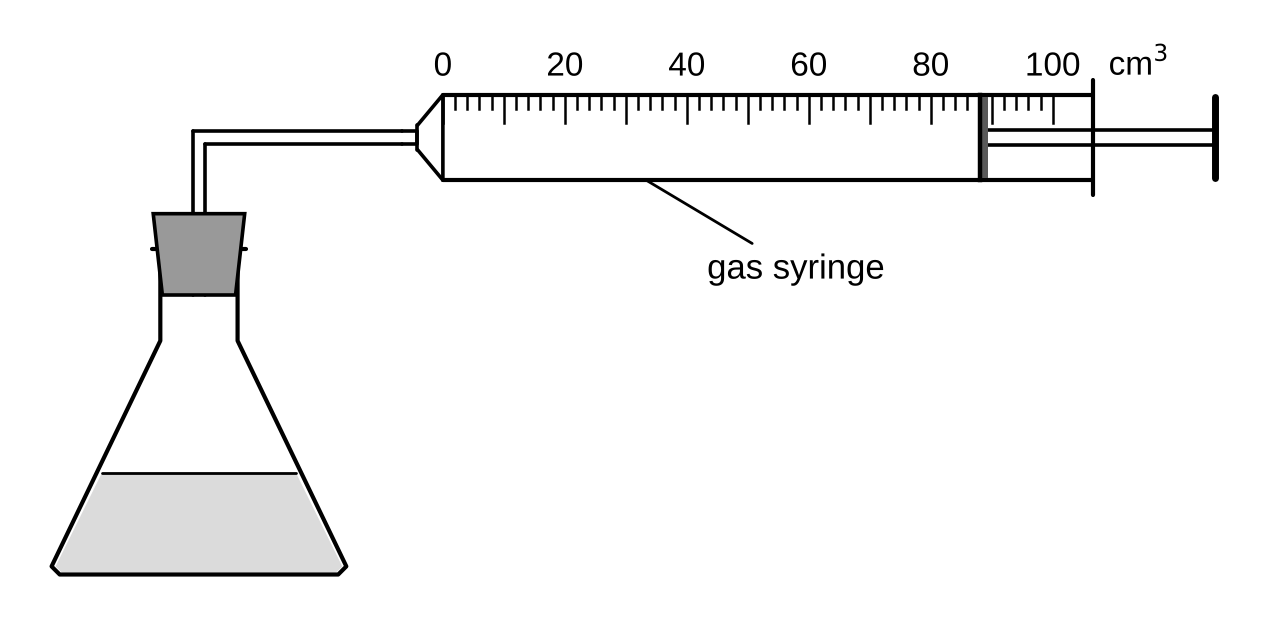
Use the reading on the gas syringe to calculate the percentage yield of hydrogen.
Percentage yield = ...... %
d.[1]
Suggest one reason why the volume of hydrogen collected is less than the maximum volume.
e.[2]
The student plans to repeat the experiment with 0.150 g of magnesium, using the same acid and the same gas syringe.
Evaluate this plan. Use a calculation in your answer.
5.1 Monitoring chemical reactions Questions
57 exam-style questions on OCR GCSE Chemistry 5.1 Monitoring chemical reactions, covering 5.1.1 The technique of titration, 5.1.2 Theoretical mass, percentage yield and atom economy, 5.1.3 Concentration of a solution in mol/dm3, 5.1.4 Concentration calculations and titration results, 5.1.5 Molar gas volume and volumes of gases in reactions, and 5.1.6 Choosing a reaction pathway. Each one has a worked solution and a mark scheme showing where the marks go.