The graph below shows the changes in membrane potential during a single action potential in a mammalian sensory neurone. The absolute refractory period is indicated on the graph.
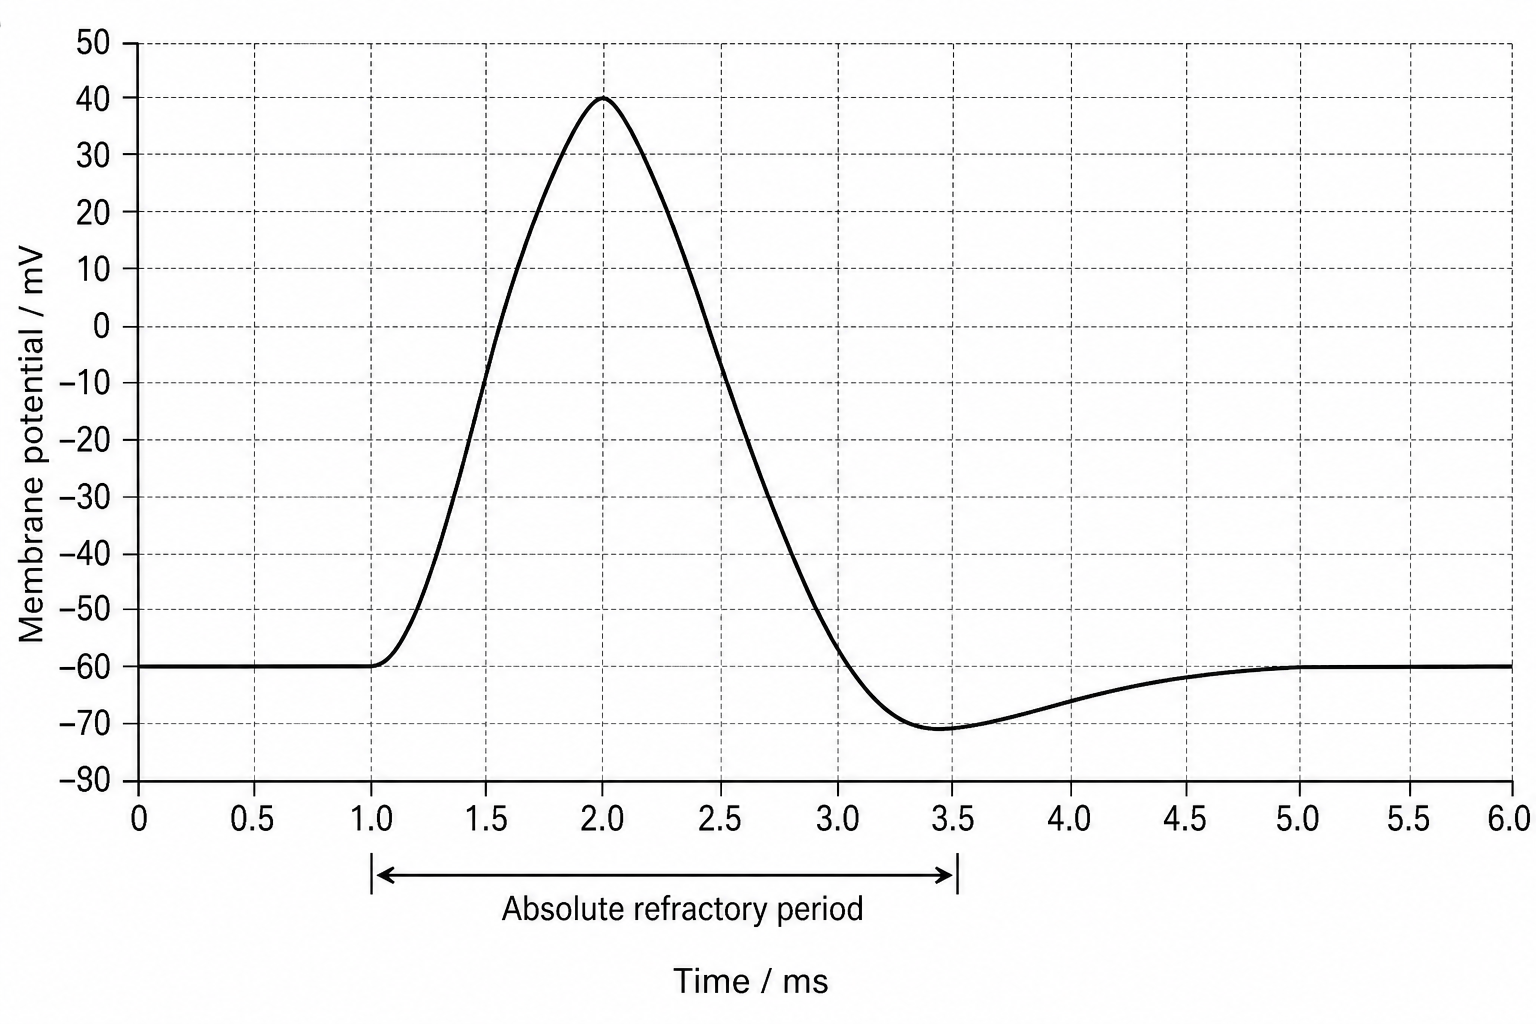
What is the maximum frequency of action potentials that this neurone can conduct?
40 s−140\text{ s}^{-1}40 s−1
200 s−1200\text{ s}^{-1}200 s−1
400 s−1400\text{ s}^{-1}400 s−1
1000 s−11000\text{ s}^{-1}1000 s−1