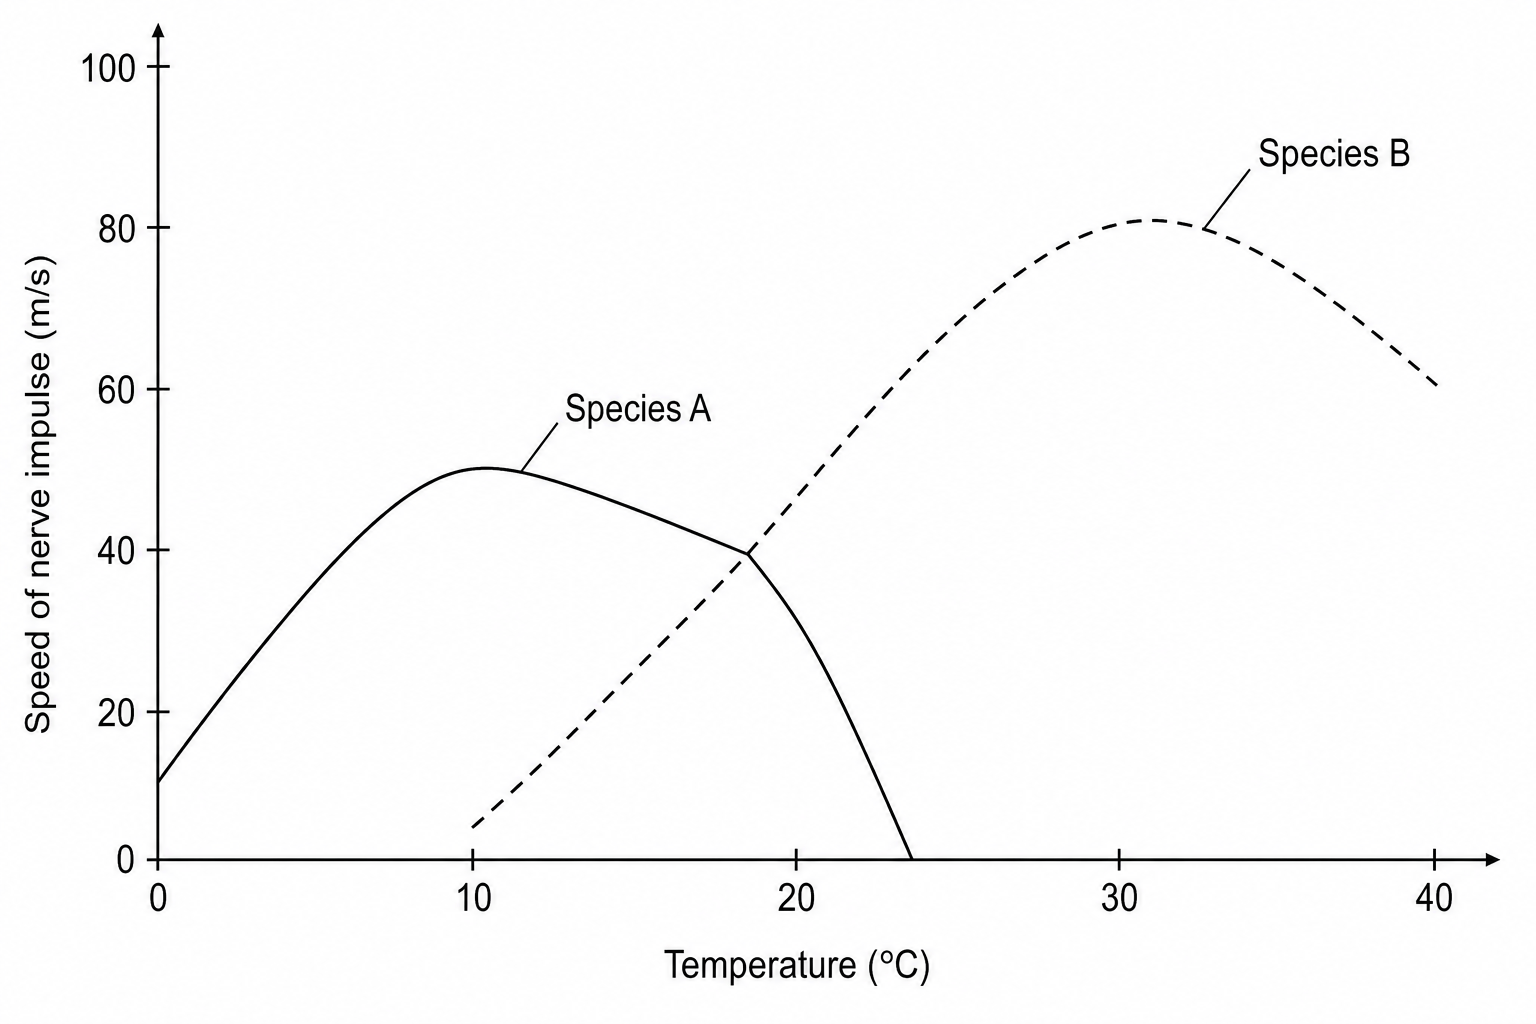
The graph shows the relationship between temperature and the speed of nerve impulses in two different species of fish: Species A (adapted to cold water) and Species B (adapted to warm water).
a.[3]
Complete the sentences using the information from the graph.
Use numbers or words from this list:
10**, 20, 30, faster, slower, negative, positive, **identical
- For Species A, between 0∘C0^\circ\text{C}0∘C and 10∘C10^\circ\text{C}10∘C, there is a ................................... correlation between temperature and nerve impulse speed.
- At a temperature of ................................... ∘C^\circ\text{C}∘C, the speed of nerve impulses is the same in both species of fish.
- At 30∘C30^\circ\text{C}30∘C, the speed of nerve impulses is ................................... in Species B than in Species A.
b.[2]
In both species of fish, photoreceptors in the eyes are located very close to the brain. Suggest one advantage of this anatomical arrangement.