Skip to content
MathsGenie logo
Open app

Course home

  1. GCSE
  2. Biology Edexcel
  3. Question bank

Homeostasis and thermoregulation

EasyMediumHard
12345678910111213141516171819202122232425
Question 22

A student monitored their core body temperature overnight for 8 hours, starting at 22:00 (Hour 0) when they went to bed, until 06:00 (Hour 8) when they woke up.
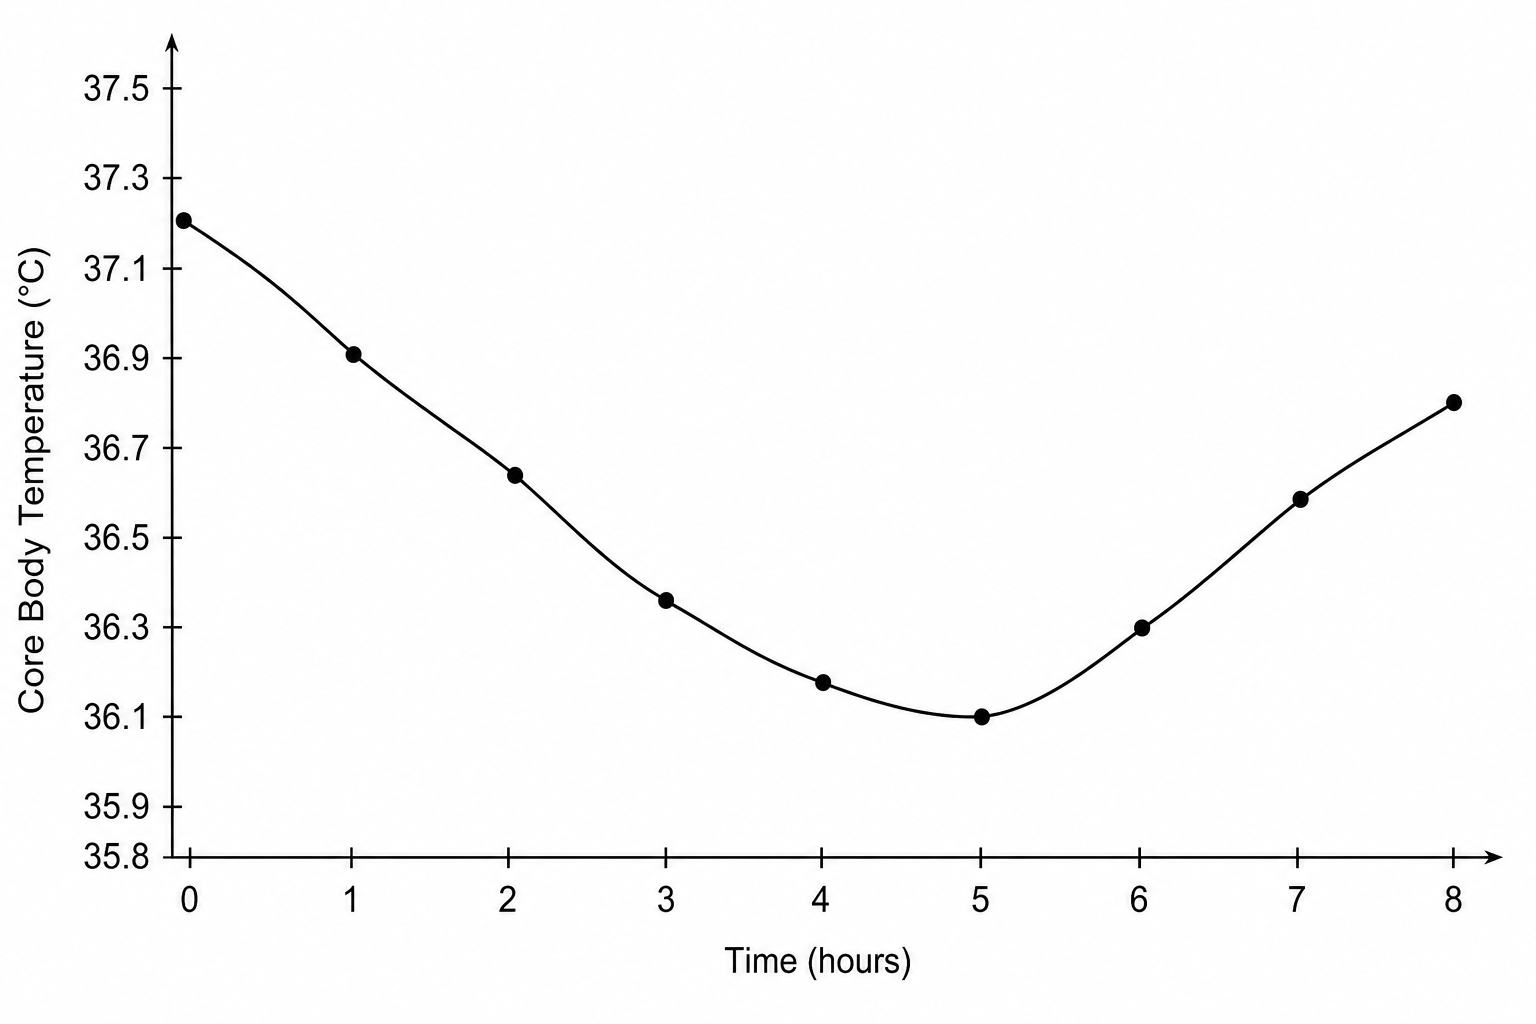
Line graph showing core body temperature on the y-axis, ranging from 35.8 °C to 37.5 °C, plotted against time in hours on the x-axis from 0 to 8 hours. The temperature curve steadily declines from 37.20 °C at 0 hours to a minimum of 36.00 °C at 5 hours, then starts to rise back up to 36.80 °C by 8 hours.

Time (hours)Core Body Temperature (°C)
0 (22:00)37.20
1 (23:00)36.90
2 (00:00)36.65
3 (01:00)36.30
4 (02:00)36.10
5 (03:00)36.00
6 (04:00)36.25
7 (05:00)36.55
8 (06:00)36.80

Explain the change in body temperature from 0 hours to 4 hours.

[3]

Homeostasis and thermoregulation Questions

  1. GCSE
  2. /Biology
  3. /Homeostasis and thermoregulation
