Question 41
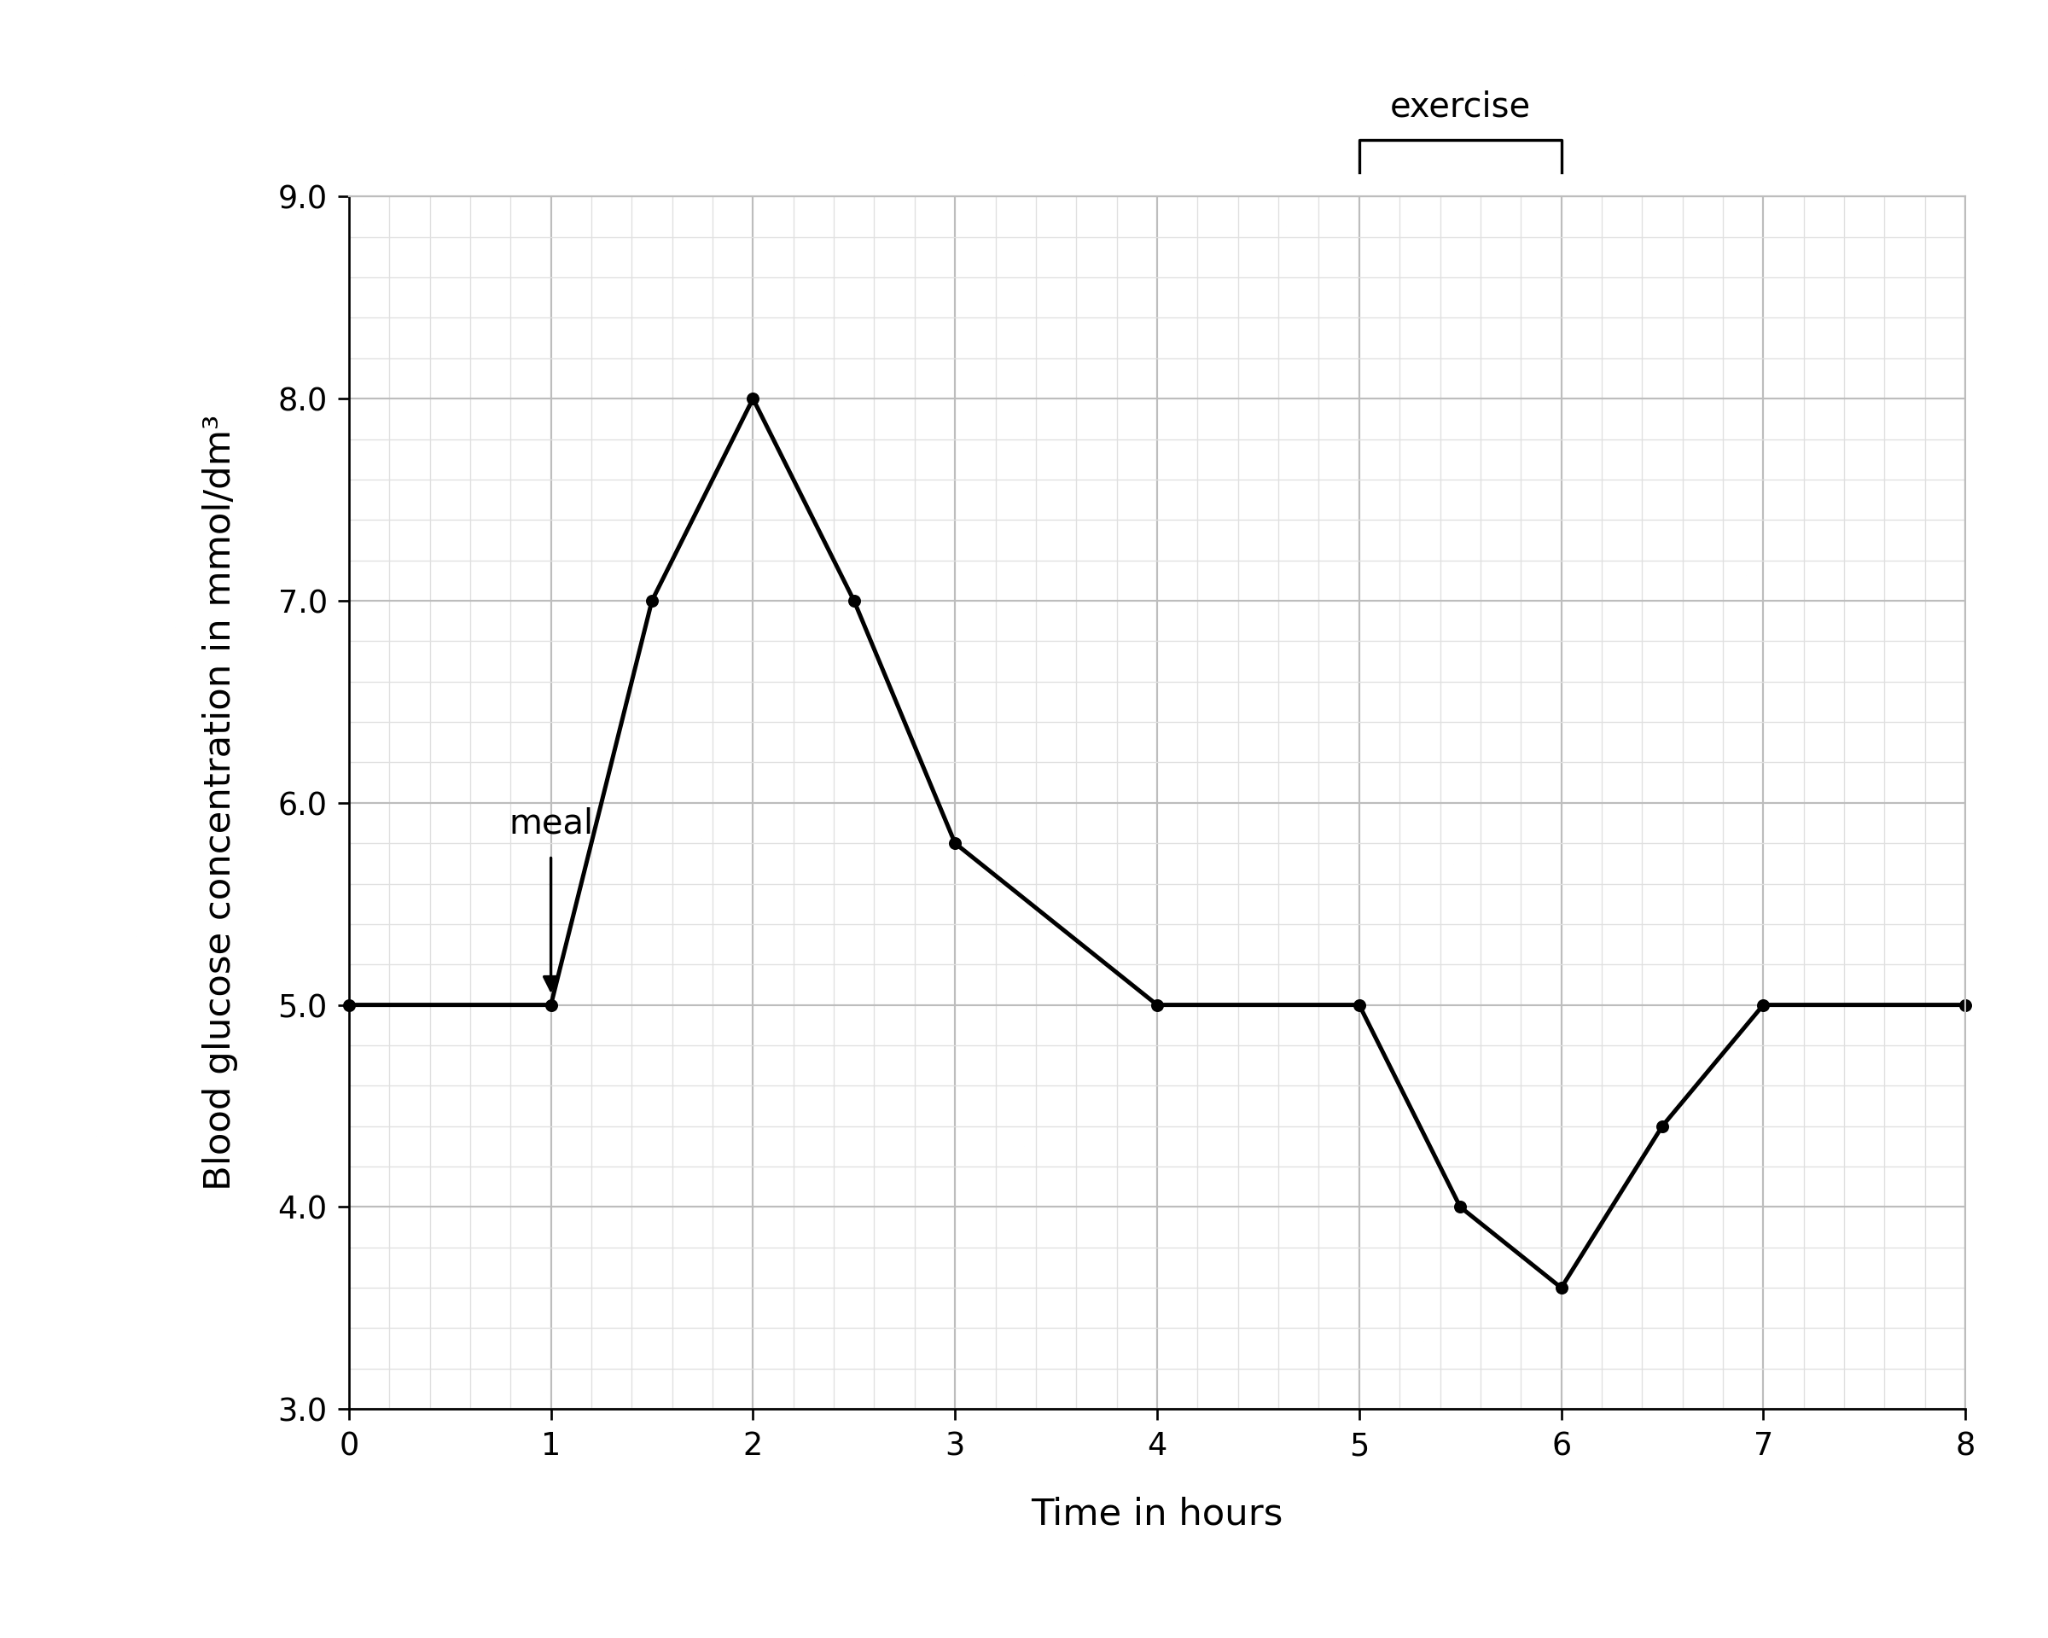
HThe Figure shows the blood glucose concentration of a healthy person over 8 hours.
The person ate a meal at 1 hour. The person exercised between 5 hours and 6 hours.
Figure
a.[2]
Explain why the blood glucose concentration increased between 1 hour and 2 hours.
b.[2]
Explain why the blood glucose concentration fell between 5 hours and 6 hours.
c.[3]
Explain how the blood glucose concentration returned to normal between 6 hours and 7 hours.
7.4 Blood glucose and the urinary system Questions
94 exam-style questions on Edexcel GCSE Biology 7.4 Blood glucose and the urinary system, covering 7.4.1 Insulin and blood glucose control, 7.4.2 Glucagon and blood glucose regulation, 7.4.3 Type 1 and type 2 diabetes, 7.4.4 Structure of the urinary system, 7.4.5 Structure and function of the nephron, 7.4.6 ADH and water regulation, 7.4.7 Treatments for kidney failure, and 7.4.8 Production of urea in the liver. Each one has a worked solution and a mark scheme showing where the marks go.