Blood glucose control, diabetes and the urinary system

EasyMediumHard
12345678910111213141516171819202122232425262728293031323334353637383940414243444546474849505152535455565758596061626364
Question 39
Easy

A student consumes a high-carbohydrate energy drink. This causes their blood glucose concentration to rise rapidly, as shown in the graph below.
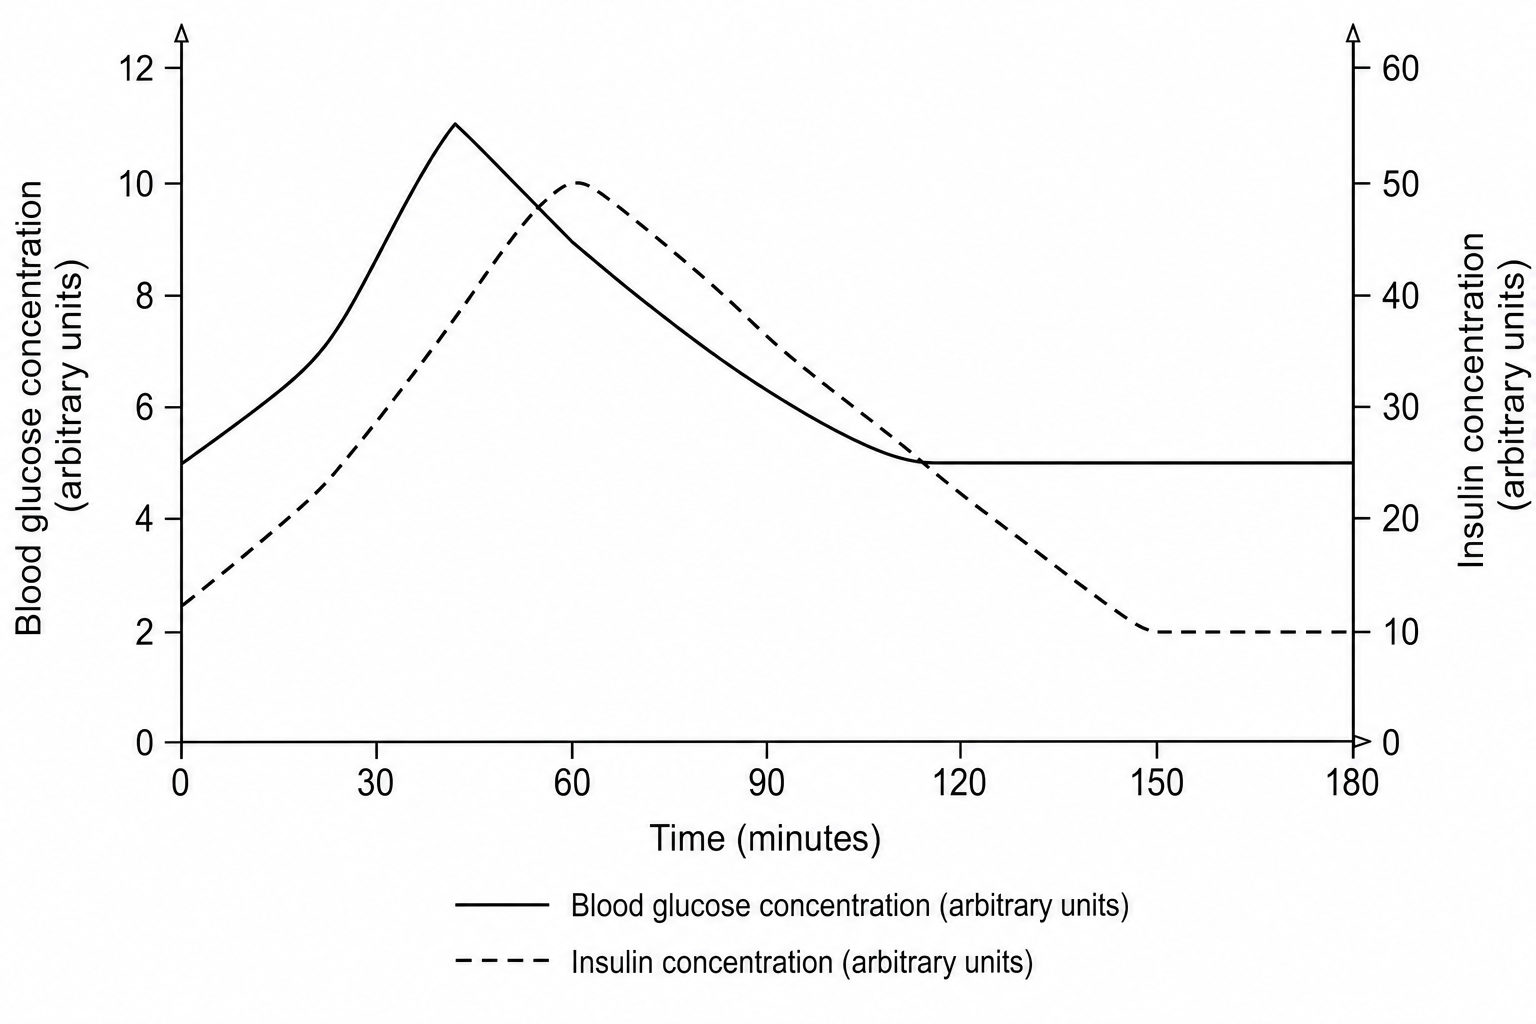
A line graph showing changes in blood glucose and blood insulin concentration over a 180-minute period after consuming a carbohydrate drink at 0 minutes. The left y-axis is 'Blood glucose concentration (arbitrary units)' ranging from 0 to 12. The right y-axis is 'Insulin concentration (arbitrary units)' ranging from 0 to 60. The x-axis is 'Time (minutes)' ranging from 0 to 180. The blood glucose line rises from a baseline of 5 to a peak of 11 at 45 minutes, then steadily falls back to 5 by 120 minutes. The insulin line rises from a baseline of 10 to a peak of 50 at 60 minutes, then falls back toward baseline by 150 minutes.

Explain why the blood glucose concentration decreases after reaching its peak.

[2]

Blood glucose control, diabetes and the urinary system Questions

  1. GCSE
  2. /Biology
  3. /Blood glucose control, diabetes and the urinary system