Quadratic Graphs Exam Questions: GCSE Guide
Quadratic graphs exam questions explained through three GCSE examples, with clear steps, method marks, common mistakes and practice advice.
Quadratic graphs can feel unusually unforgiving. One inaccurate point changes the curve; one misread scale changes a root; one forgotten line can hide the solution completely. Yet quadratic graphs exam questions are often built from a small set of repeatable skills: calculate coordinates, draw a smooth parabola, add another line when needed, and read estimates carefully.
This guide follows a hypothetical student, Aisha, through three exam-style questions of rising difficulty. The aim is not merely to reach each answer. It is to see which working may earn method marks, even when a final estimate is slightly inaccurate.
The method to use in a quadratic graphs GCSE exam
Before touching the calculator, Aisha writes a short checklist beside the question:
- inspect both axes and their scales;
- substitute carefully to complete any table;
- plot each coordinate with a small, precise cross;
- join the points using one smooth curve;
- draw any additional line required by the equation;
- read every solution from the horizontal axis;
- give estimates to a sensible accuracy.
This is the basic rhythm behind most GCSE questions on the topic. You can review the full process in the Maths Genie drawing quadratic graphs lesson, then apply it using the accompanying quadratic graphs exam booklet.
Mark allocations vary between questions and exam boards, so never assume that each step is worth a fixed number of marks. In general, however, correct substitution, accurate plotting, a suitable curve and a valid graphical method can all provide evidence that a mark scheme may reward.
Once you have this method in hand, use the Maths Genie Lessons and Question Bank to practise setting up curves and solution lines without having to find suitable questions yourself.
Question one: completing a table and drawing the curve
Aisha's first question asks her to complete a table and draw the graph
y=x2−x−6y=x^2-x-6y=x2−x−6for values of xxx from −2-2−2 to 444.
Calculate one value at a time
For x=−1x=-1x=−1, she substitutes the value with brackets:
y=(−1)2−(−1)−6y=(-1)^2-(-1)-6y=(−1)2−(−1)−6 y=1+1−6=−4y=1+1-6=-4y=1+1−6=−4The brackets matter because (−1)2=1(-1)^2=1(−1)2=1. Repeating the process gives:
| xxx | −2-2−2 | −1-1−1 | 000 | 111 | 222 | 333 | 444 |
|---|---|---|---|---|---|---|---|
| yyy | 000 | −4-4−4 | −6-6−6 | −6-6−6 | −4-4−4 | 000 | 666 |
Plot and join the coordinates
Aisha plots the seven points, checks them against the table, and draws a smooth U-shaped curve. She does not join consecutive coordinates using straight line segments because a quadratic graph is curved.
There are several possible sources of credit here:
- correct values produced through substitution;
- coordinates plotted in the correct positions;
- a single smooth curve passing through the points;
- the graph drawn across the requested interval.
A wrong table value does not mean the whole question is lost. If the remaining coordinates and curve are accurate, there may still be marks available. This is why visible working is valuable.
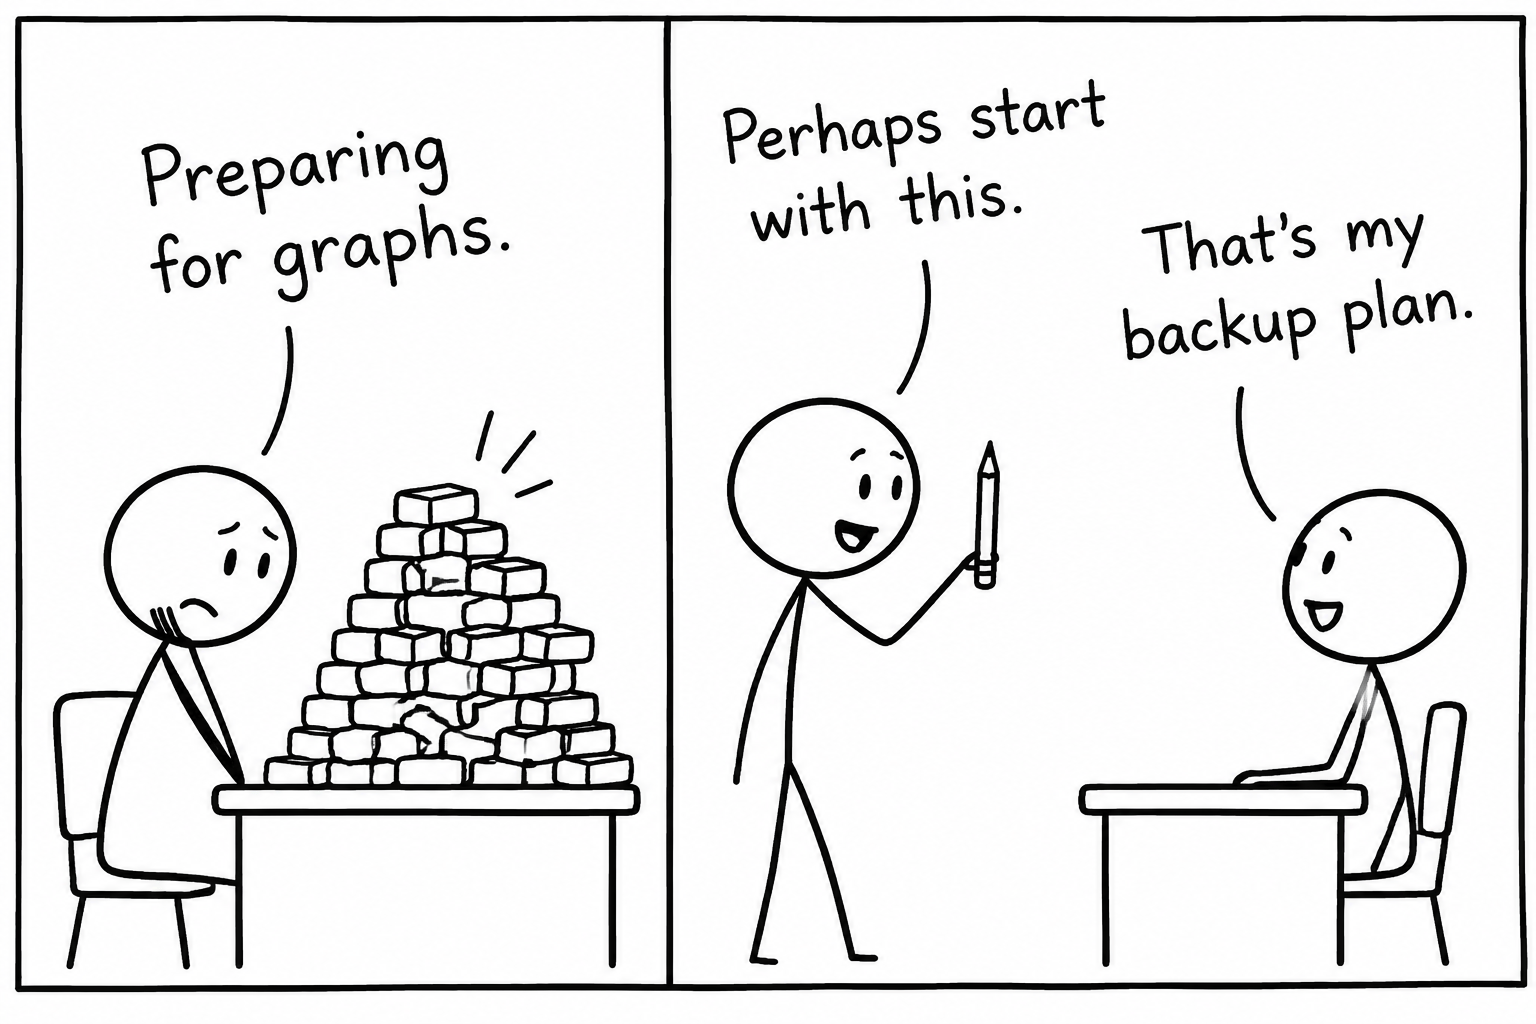 XKCD-style comic of a student preparing for graphs with an enormous pile of erasers
Students who want to watch this process before attempting it independently can use the GCSE Maths video lessons. The nearby topics on expanding, factorising and solving are also useful because quadratic equations and graphs describe the same relationships in different ways.
Question two: solving an equation from the graph
The next question uses the same parabola:
Use your graph to solve x2−x−6=2x^2-x-6=2x2−x−6=2.
Aisha's first instinct is to factorise. That would miss the instruction. The words use your graph mean that the examiner expects a graphical construction and estimated answers.
Turn the equation into an intersection
The curve already represents
y=x2−x−6.y=x^2-x-6.y=x2−x−6.To find where its value equals 222, Aisha draws the horizontal line
y=2.y=2.y=2.She extends it across the grid and marks both points where it crosses the parabola. She then reads vertically down to the xxx-axis.
Her estimates are
x≈−2.4orx≈3.4.x\approx -2.4 \quad \text{or} \quad x\approx 3.4.x≈−2.4orx≈3.4.The precise estimates depend on the scale and accuracy of the drawn curve. Answers close to these values may therefore be accepted within a range specified by the mark scheme.
Where the method marks may come from
The essential method is the line y=2y=2y=2. If Aisha draws that line correctly but slightly misreads one intersection, the construction still demonstrates a valid approach. Depending on the particular mark scheme, this may preserve some credit.
She also records both answers. A horizontal line can cross an upward-opening parabola twice, so stopping after the first intersection is a costly habit.
This relationship between equations and intercepts is explored further in the quadratic equations revision guide. It helps explain why solving a quadratic often produces two roots.
Question three: finding where a curve meets a line
The final question raises the difficulty:
The curve y=x2−x−6y=x^2-x-6y=x2−x−6 and the line y=2x−4y=2x-4y=2x−4 are drawn on the same axes. Use the graphs to solve x2−x−6=2x−4x^2-x-6=2x-4x2−x−6=2x−4.
Aisha pauses. The equation looks more complicated, but the graph offers a simple interpretation: both expressions have the same value wherever the two graphs meet.
Draw the straight line accurately
If the line is not already provided, Aisha chooses convenient values:
| xxx | 000 | 222 | 444 |
|---|---|---|---|
| y=2x−4y=2x-4y=2x−4 | −4-4−4 | 000 | 444 |
She plots (0,−4)(0,-4)(0,−4), (2,0)(2,0)(2,0) and (4,4)(4,4)(4,4), then joins them using a ruler. Two points are mathematically sufficient for a straight line, but the third acts as a check.
The line meets the curve twice. Reading down from the intersections gives approximately
x≈−0.6orx≈3.6.x\approx -0.6 \quad \text{or} \quad x\approx 3.6.x≈−0.6orx≈3.6.Aisha could also read the corresponding yyy-coordinates if requested. They are approximately
y≈−5.2andy≈3.2.y\approx -5.2 \quad \text{and} \quad y\approx 3.2.y≈−5.2andy≈3.2.Graphical answers are estimates, so small differences caused by plotting are normal. The important method is to draw the required line, identify both intersections and read from the correct axis.
For broader algebra preparation, the guide to learning GCSE Maths topics in a sensible order places quadratics alongside the skills that support them. Students who feel that algebra is the main obstacle can also revisit the GCSE algebra guidance.
Common mistakes in quadratic graphs exam questions
Ignoring negative-number brackets
Entering −22-2^2−22 into a calculator can be interpreted differently from (−2)2(-2)^2(−2)2. When substituting a negative value, use brackets:
(−2)2=4.(-2)^2=4.(−2)2=4.Drawing straight segments through plotted points
A quadratic graph should be one smooth parabola. Do not use a ruler to connect each adjacent pair of coordinates.
Reading from the wrong axis
If the question asks you to solve an equation, it usually wants xxx-values. Find each intersection and read vertically to the xxx-axis.
Forgetting the additional line
For an equation such as
x2−x−6=2,x^2-x-6=2,x2−x−6=2,the required construction is y=2y=2y=2. For
x2−x−6=2x−4,x^2-x-6=2x-4,x2−x−6=2x−4,the required construction is y=2x−4y=2x-4y=2x−4. Writing an answer without showing the line may remove the evidence for your method.
Giving only one solution
Always scan the whole graph. A line may cross a quadratic curve twice, once, or not at all within the displayed region.
Claiming excessive accuracy
A graph drawn on a printed grid rarely justifies many decimal places. Match your answer to the scale, commonly to one decimal place when the intersection lies between labelled values.
Exam-style practice to try next
Use the same curve, y=x2−x−6y=x^2-x-6y=x2−x−6, to attempt these tasks:
- state the coordinates where the curve crosses the xxx-axis;
- estimate the coordinates of its turning point;
- draw y=−4y=-4y=−4 and solve x2−x−6=−4x^2-x-6=-4x2−x−6=−4;
- draw y=x−2y=x-2y=x−2 and estimate the solutions of x2−x−6=x−2x^2-x-6=x-2x2−x−6=x−2;
- explain why a horizontal line above the turning point can meet this curve twice.
Check that every graphical answer includes the construction that produced it. That habit matters when you move from practice exercises to quadratic graphs past paper questions, where working can be as important as the final estimate.
Turn the method into reliable exam practice
Aisha's progress is not a sudden leap. She simply stops treating every question as a new puzzle: table, curve, extra line, intersections, answers. Knowing that sequence is useful, but following it accurately under exam conditions requires repeated practice.
Your turn. Build that routine with the Maths Genie quadratic graphs Lessons and Question Bank, working from basic plotting to equation-solving questions.