GCSE Statistics Long Answer Questions: Top Marks
GCSE statistics long answer questions explained: learn how examiners reward method, evidence, context, conclusions and precise statistical reasoning in exams.
A statistics answer can be numerically correct and still feel unfinished. You calculate the median, compare two graphs, write a sentence, and the mark scheme seems to want something more.
That "something" is usually not more writing. In GCSE statistics long answer questions, examiners reward a connected argument: choose an appropriate method, show reliable evidence, interpret it in context and reach a conclusion that the evidence can support. A top-mark response makes every sentence do a job.
This matters in dedicated GCSE Statistics and in the statistics content of GCSE Maths. Exact wording and marking vary between Edexcel, AQA, OCR, Eduqas and other specifications, so always check your own papers and mark schemes. The principles below, however, are widely useful.
The long-answer checklist
Before moving on, ask whether your response contains:
- the correct statistic, graph or statistical method;
- enough working for the method to be followed;
- specific evidence taken from the data;
- an interpretation using the question's context;
- a comparison of like with like, where required;
- a limitation or qualification, if the question asks for evaluation;
- a conclusion that answers the precise question.
The central lesson is simple: calculation, evidence and interpretation belong together.
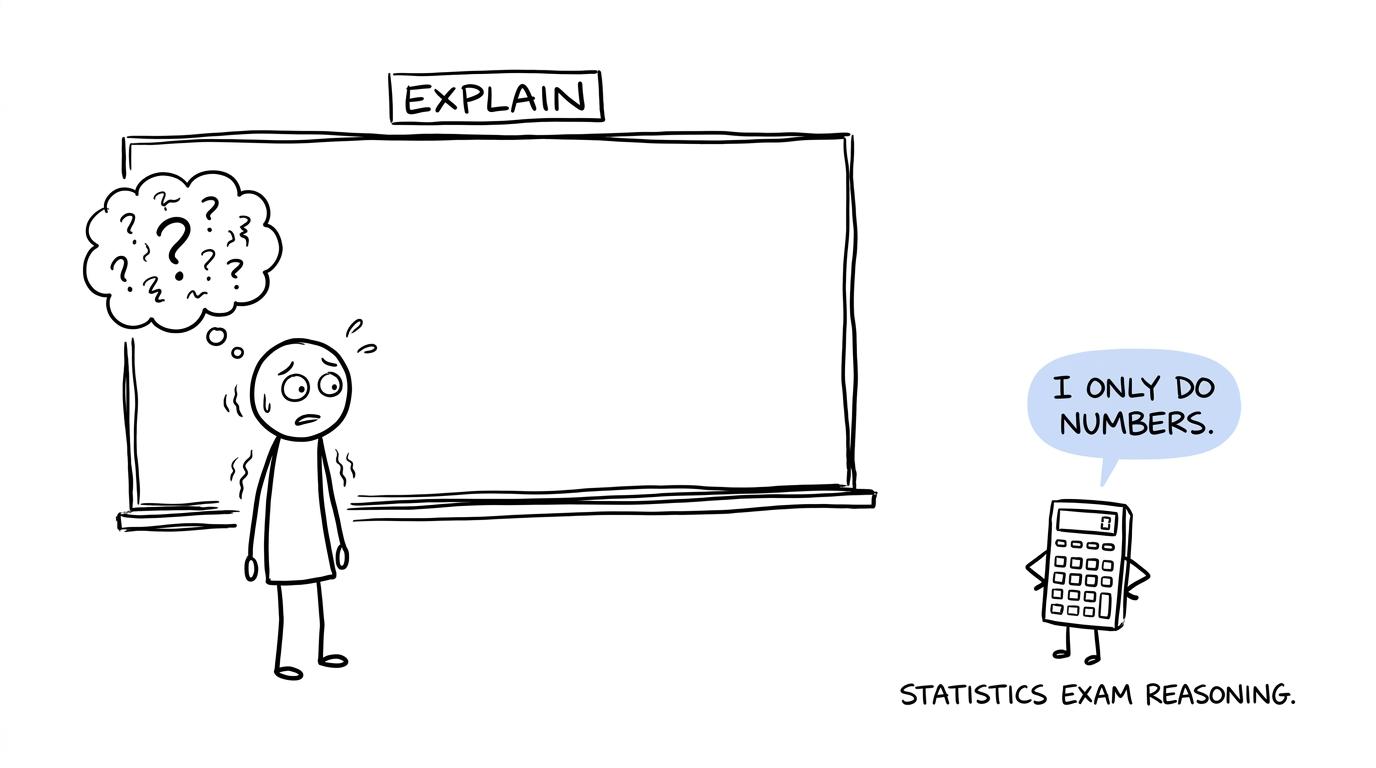 A student discovers that a calculator cannot write an explanation
What separates a top-mark response from an average one?
An average response often contains a correct fact. A stronger response turns that fact into evidence for a relevant judgement.
Suppose a question asks students to compare two distributions. Saying that one group has a higher median identifies a feature. It does not yet explain what that feature means. A complete comparison connects the statistic to the variable: the group with the higher median generally has the higher typical value.
Spread needs the same treatment. For a box plot, the interquartile range is
IQR=Q3−Q1.\operatorname{IQR}=Q_3-Q_1.IQR=Q3−Q1.A smaller interquartile range indicates that the middle half of the observations is less spread out. In context, that may suggest more consistent times, measurements or scores. "More consistent" should therefore be supported by a measure of spread rather than presented as an unsupported impression.
The best responses usually have four qualities.
They answer the command word
Different commands require different actions:
- Calculate requires a value supported by working.
- Compare requires direct similarities or differences between data sets.
- Describe requires relevant features of a distribution or relationship.
- Interpret requires those features to be explained in context.
- Explain requires a reason, not just an observation.
- Evaluate requires a judgement supported by strengths, weaknesses or limitations.
Students sometimes answer the topic rather than the command. A paragraph about sampling methods does not answer whether a particular sample is representative unless it refers to the method and population in the question.
They use precise evidence
Evidence should normally be identifiable in the data. Depending on the question, it might include a median, mean, range, interquartile range, proportion, trend, outlier or feature of the sampling process.
Avoid vague claims such as "the results are much better" when the data allow a precise comparison. Equally, avoid listing every number on the page. Select evidence that helps answer the question.
For comparison questions, pair the centre with the spread where both are relevant:
- centre describes a typical or central value;
- spread describes variation or consistency.
The MathsGenie box plots revision guide reviews medians, quartiles and spread, while the cumulative frequency revision guide explains how these values can be estimated from a graph.
They interpret, rather than merely repeat
Interpretation translates a statistical result into the language of the situation. If a calculation produces an estimate, say what has been estimated. If a scatter graph shows an association, name the variables and describe how they tend to change together.
This is also where cautious language matters. Correlation does not by itself establish causation. A relationship between two variables may be influenced by other factors, and extrapolating beyond the observed data is generally less reliable than interpolating within its range.
They keep the conclusion within the evidence
A conclusion should be decisive but not exaggerated. Sample data can provide evidence about a population, but the strength of that evidence depends on features such as sample selection, sample size, non-response and possible bias.
A good final sentence answers the question while acknowledging uncertainty where it genuinely matters. It does not add a limitation automatically to every response; it adds one when the design or command word makes it relevant.
Build answers from claim, evidence and context
A dependable structure for extended statistical reasoning is:
- Claim: state the relevant comparison, pattern or judgement.
- Evidence: support it with an appropriate statistic or feature.
- Context: explain what that evidence means for the people, objects or measurements in the question.
For an evaluation, add a fourth element:
- Qualification: identify a specific limitation and explain its likely effect.
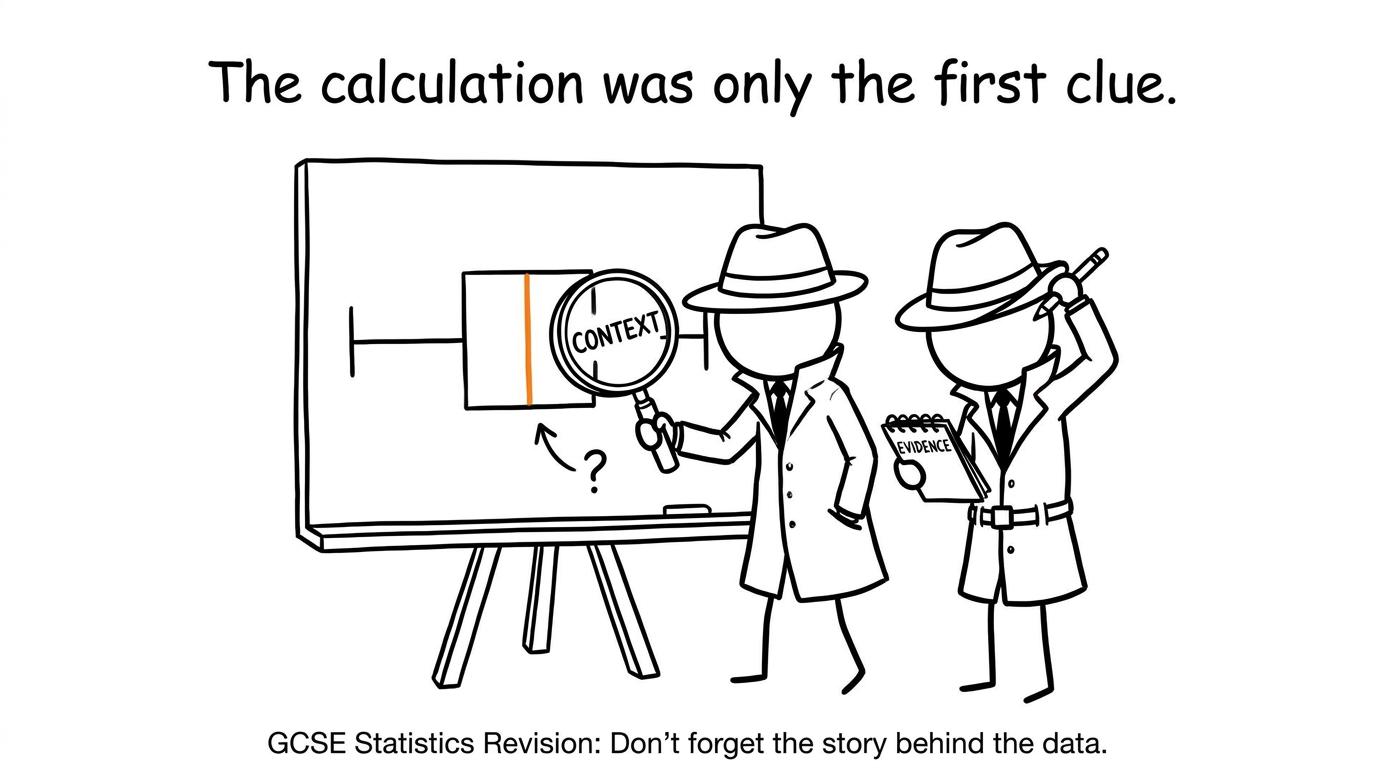 Statistics detectives discover that context is part of the evidence
This structure is not a script to copy mechanically. It is a way to test whether your reasoning has crossed the gap between "I found a number" and "I used that number to answer the question".
Show the method, not every thought
Long-answer questions often combine calculation and interpretation. Clear working protects the logic of your answer and may allow credit for a valid method even when a later arithmetic error occurs, although the exact marks available always depend on the question's mark scheme.
Write down the formula or operation you are using, substitute carefully and retain enough accuracy during intermediate stages. For an estimated mean from grouped data, the underlying method is
estimated mean=∑fx∑f,\text{estimated mean}=\frac{\sum fx}{\sum f},estimated mean=∑f∑fx,where xxx represents class midpoints. The result is an estimate because the exact observations within each class are unknown.
That final explanation can matter as much as the calculation when the question asks why the answer is estimated. You can practise this distinction with the averages from frequency tables questions.
For histograms, remember that frequency is represented by area. The relationship is
frequency density=frequencyclass width.\text{frequency density}=\frac{\text{frequency}}{\text{class width}}.frequency density=class widthfrequency.Writing the relationship before calculating makes the method visible and reduces the temptation to compare bar heights when class widths differ.
Match the evidence to the statistical question
The statistic you choose should answer the question being asked.
Comparing distributions
Use measures of centre for typical values and measures of spread for consistency or variability. Compare the same measure across both distributions. A median from one group should not normally be compared with a mean from another as though they measure exactly the same feature.
If outliers or skew may affect the mean and range, the median and interquartile range can provide a more resistant summary. Whether that matters depends on the displayed data and the question.
Interpreting scatter graphs
Describe the direction and apparent strength of the association, then mention relevant outliers if present. Predictions should use the line of best fit sensibly and should not claim certainty.
Most importantly, do not write that one variable causes the other merely because there is correlation. Statistical association is evidence of a relationship, not automatic proof of cause.
Evaluating samples and questionnaires
Name the flaw specifically. "The sample is biased" is weaker than identifying how participants were selected and explaining which part of the population may be under-represented.
For questionnaires, consider leading wording, overlapping response categories, missing options, unclear time frames and questions that ask about two things at once. Then explain how the flaw could distort the results.
Judging representations of data
Check scales, intervals, labels and whether area or height represents frequency. A truncated vertical axis can make a difference appear visually larger, while unequal class widths make histogram heights unsafe to compare without considering density or area.
The broader GCSE Statistics revision hub brings together board-specific papers, worksheets and questions, making it easier to see these ideas in authentic exam formats.
Write enough, then stop
More lines do not automatically earn more marks. Repetition can even hide a sound argument.
Use the available space as a clue, not a required word count. A concise response with two supported comparisons may be stronger than a long paragraph containing several vague observations. Once you have answered the command, supplied evidence and interpreted it, stop.
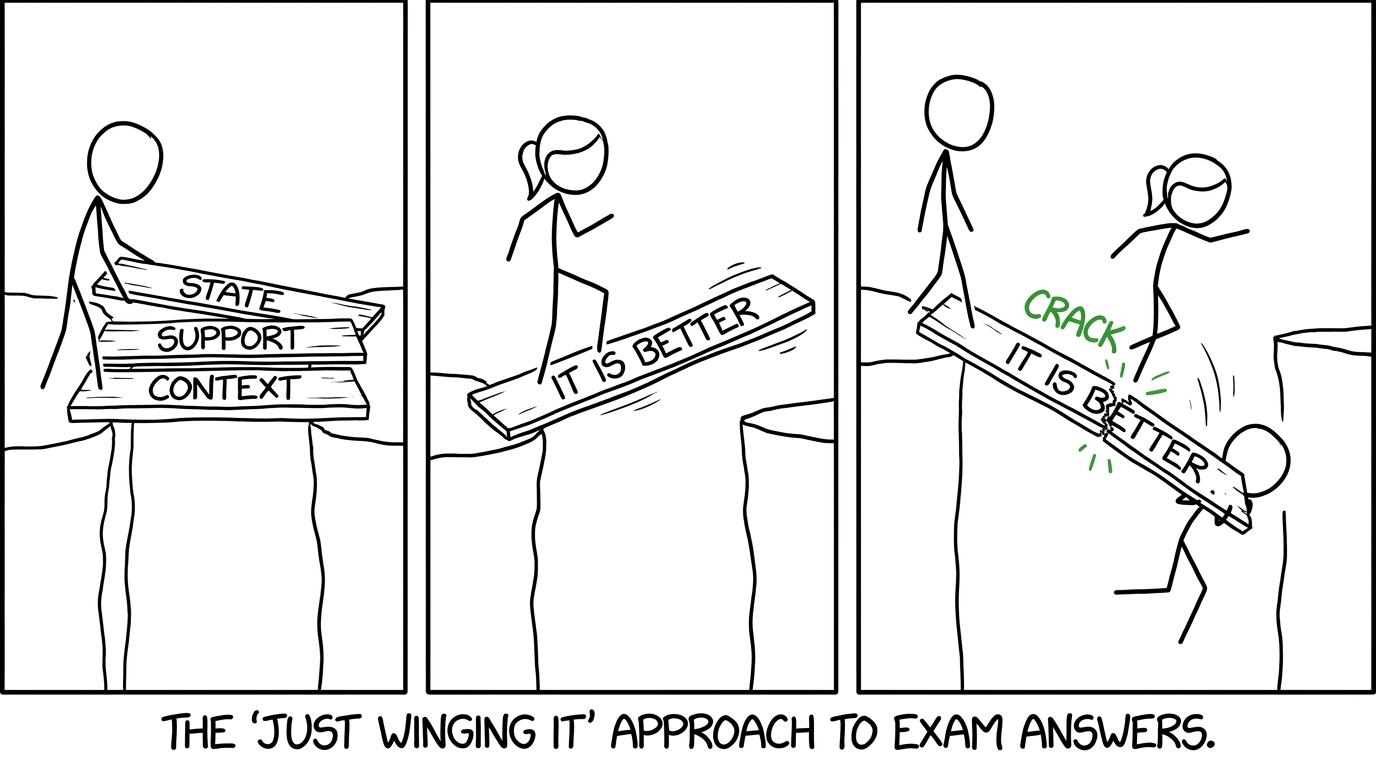 One student crosses the reasoning gap while another relies on a vague claim
Common mistakes in statistics long answers
Giving numbers without meaning
A median, range or percentage is evidence, not a conclusion. Follow it with what it shows in the context.
Making unsupported comparisons
Words such as "better", "safer" or "more reliable" need an appropriate statistic and a clear definition. Data may show faster performance without showing better performance overall.
Discussing centre but ignoring spread
When asked to compare distributions, one statement about the median may not cover variation. Look for an interquartile range, range or another suitable measure of spread.
Treating correlation as causation
Write that the variables are associated or tend to change together. Do not claim that one causes the other unless the evidence and study design justify it.
Naming a limitation without its effect
"Small sample" or "biased question" is incomplete evaluation. Explain why the weakness matters and how it could affect the conclusion.
Rounding too early
Keep sufficient calculator accuracy during working and round at the end to the accuracy requested. Include units where they are meaningful.
Ignoring the exact population
A conclusion about sampled pupils, households or products should not silently become a claim about everyone. Check who was sampled and who the researcher wants to understand.
Practise the reasoning, not just the arithmetic
Start with one long question from the Edexcel GCSE Statistics revision area or the appropriate section of the main Statistics hub. Complete it without notes, then compare every phrase with the mark scheme.
Sort lost marks into four useful categories: method, accuracy, interpretation and communication. Rewrite only the weak part, then attempt a similar question later without copying your correction. This is more effective than simply reading a model answer and feeling that it "makes sense".
As confidence grows, move into timed papers. MathsGenie's free GCSE and A Level maths revision resources help you combine revision lessons and practice questions with past papers, predicted papers, mini tests, mark schemes and video solutions. Add each weak skill to your revision planner so that mistakes become future tasks rather than forgotten frustrations.
Turn correct calculations into complete arguments
The difference between an average response and a top-mark one is rarely a clever phrase. It is usually a chain of small, disciplined choices: read the command word, select the right evidence, show the method, interpret in context and make no claim larger than the data can carry.
That is encouraging because it can be practised. Visit the MathsGenie GCSE Statistics hub, choose your exam board and begin with one extended question. Mark it honestly, repair the missing link in your reasoning, then try again. Top-mark statistical writing is not about sounding impressive; it is about making the evidence impossible to misunderstand.