GCSE Probability Tree Diagrams Explained
GCSE probability tree diagrams explained with clear steps, worked examples and common mistakes. Build confidence for Edexcel, AQA, OCR and Eduqas.
Probability can feel polite right up until the exam paper asks you for “exactly one win” or “given that…”. Then it stops being polite and starts taking marks. That’s why GCSE probability tree diagrams matter: they turn a fuzzy story into a clean map of decisions, and that map tells you exactly when to multiply, when to add, and when to use “at least one” as a shortcut rather than a trap.
In this guide, you’ll see GCSE probability tree diagrams explained in the way mark schemes reward: clear branches, correct complements, and the right total at the end. We’ll also connect the same ideas to A Level-style conditional probability, because the habits you build now travel further than you think.
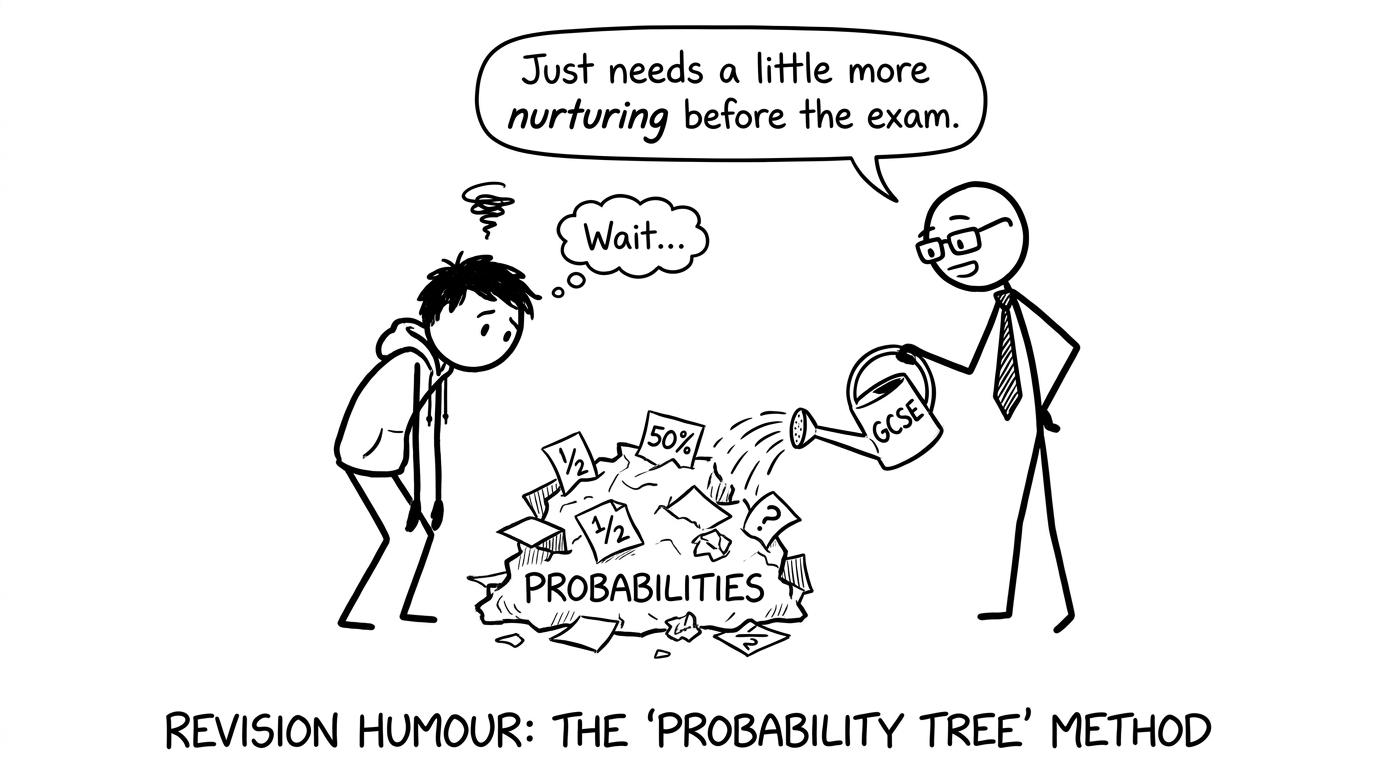 Student watering a probability tree before GCSE
A quick checklist for probability tree diagrams
Use this checklist before you even touch the numbers. It’s the difference between “I knew how to do it” and “I got the marks”.
- Draw branches in the order events happen (first event on the left, second event next, etc.).
- Every set of branches from a single point must add to 111.
- If events are independent, the second set of branches stays the same.
- If there is no replacement, the second set of branches changes.
- Multiply along a path (down the branches) for an “and” probability.
- Add different paths that match your event for an “or” probability.
- For “at least one”, consider using the complement: 1−P(none)1-P(\text{none})1−P(none).
If you want a refresher on the basics of probability language first, use: Probability revision.
Why GCSE probability tree diagrams are such a big deal
A tree diagram is really a story told one choice at a time. The exam board gives you a sequence: first this happens, then that happens. A probability tree diagram respects that sequence.
At GCSE, tree diagrams are often worth 333 to 555 marks because they test multiple skills at once:
- Can you translate words into probabilities?
- Can you use complements, like P(not win)=1−P(win)P(\text{not win})=1-P(\text{win})P(not win)=1−P(win)?
- Can you combine probabilities correctly?
And if you’re aiming for grades 777-999 on higher tier, “given that” questions (conditional probability) often sit right next to tree diagram questions. Maths Genie’s Conditional Probability lesson links beautifully with the tree diagram method.
How to read a probability tree diagram
Multiply down the branches
When you follow one complete path, you are finding an “and” probability.
If the path has probabilities aaa then bbb, the probability of that path is:
P(path)=a×b P(\text{path})=a\times b P(path)=a×bAdd across the paths
If your event can happen in more than one way (more than one complete path matches), you add those path probabilities.
If event EEE corresponds to paths with probabilities p1p_1p1 and p2p_2p2, then:
P(E)=p1+p2 P(E)=p_1+p_2 P(E)=p1+p2That’s the rhythm: multiply down, add across. It’s simple enough to remember under pressure, which is exactly why it works.
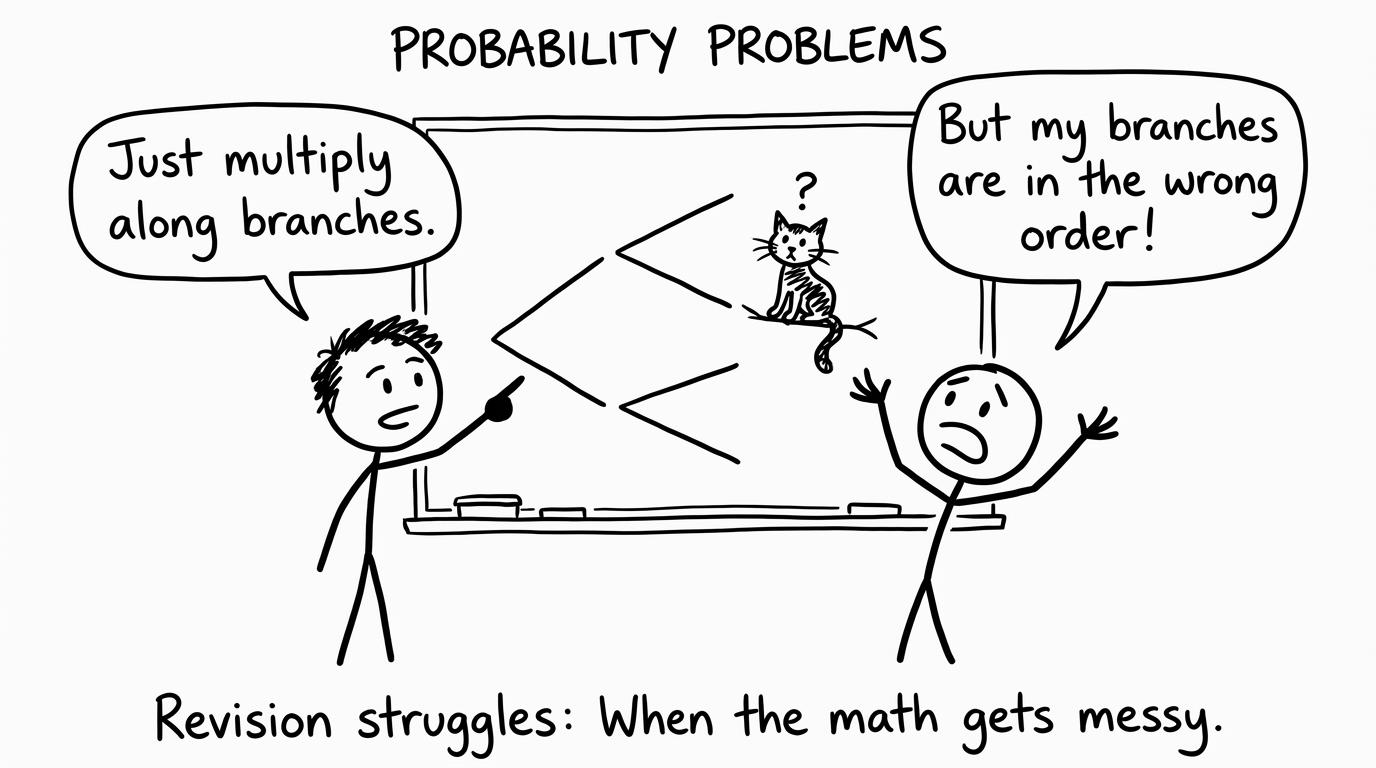 Two students argue about multiplying branches in the wrong order
Worked example 1: independent events (stays the same)
A student plays two independent games.
- Probability of winning Game 1 is 0.60.60.6.
- Probability of winning Game 2 is 0.70.70.7.
Because the games are independent, the probabilities for Game 2 do not change based on Game 1.
Find the probability the student wins both games
“Wins both” is a single path: win then win.
P(win both)=0.6×0.7=0.42 P(\text{win both})=0.6\times 0.7=0.42 P(win both)=0.6×0.7=0.42Find the probability the student wins exactly one game
Exactly one win means either:
- win then lose, or
- lose then win.
First compute the complements:
P(lose Game 1)=1−0.6=0.4 P(\text{lose Game 1})=1-0.6=0.4 P(lose Game 1)=1−0.6=0.4 P(lose Game 2)=1−0.7=0.3 P(\text{lose Game 2})=1-0.7=0.3 P(lose Game 2)=1−0.7=0.3Now add the two matching paths:
P(exactly one win)=(0.6×0.3)+(0.4×0.7) P(\text{exactly one win})=(0.6\times 0.3)+(0.4\times 0.7) P(exactly one win)=(0.6×0.3)+(0.4×0.7) =(0.18)+(0.28)=0.46 =(0.18)+(0.28)=0.46 =(0.18)+(0.28)=0.46This is the kind of tidy, mark-scheme-friendly structure that GCSE questions reward.
To practise exactly this style, use the Maths Genie booklet: Probability Trees exam questions.
Worked example 2: without replacement (probabilities change)
A bag contains 555 red counters and 333 blue counters. Two counters are taken at random without replacement.
Step 1: first pick probabilities
Total counters =8=8=8.
P(R1)=58,P(B1)=38 P(R_1)=\frac{5}{8},\quad P(B_1)=\frac{3}{8} P(R1)=85,P(B1)=83Step 2: second pick probabilities depend on the first
If the first counter was red, remaining counters are 444 red and 333 blue, total 777.
P(R2∣R1)=47,P(B2∣R1)=37 P(R_2\mid R_1)=\frac{4}{7},\quad P(B_2\mid R_1)=\frac{3}{7} P(R2∣R1)=74,P(B2∣R1)=73If the first counter was blue, remaining counters are 555 red and 222 blue, total 777.
P(R2∣B1)=57,P(B2∣B1)=27 P(R_2\mid B_1)=\frac{5}{7},\quad P(B_2\mid B_1)=\frac{2}{7} P(R2∣B1)=75,P(B2∣B1)=72Find the probability of two blues
Two blues is the path B1B_1B1 then B2B_2B2:
P(B1∩B2)=38×27=656=328 P(B_1\cap B_2)=\frac{3}{8}\times\frac{2}{7}=\frac{6}{56}=\frac{3}{28} P(B1∩B2)=83×72=566=283Find the probability of different colours
Different colours means RBRBRB or BRBRBR.
P(RB)=58×37=1556 P(RB)=\frac{5}{8}\times\frac{3}{7}=\frac{15}{56} P(RB)=85×73=5615 P(BR)=38×57=1556 P(BR)=\frac{3}{8}\times\frac{5}{7}=\frac{15}{56} P(BR)=83×75=5615So:
P(different)=1556+1556=3056=1528 P(\text{different})=\frac{15}{56}+\frac{15}{56}=\frac{30}{56}=\frac{15}{28} P(different)=5615+5615=5630=2815This “no replacement means changing denominators” point is a classic GCSE separator.
For similar questions (including tree diagrams and other probability styles), see: Probability and Relative Frequency questions.
Worked example 3: “at least one” using the complement
A bus is late on any given day with probability 0.20.20.2. Assume the days are independent. Find the probability the bus is late on at least one of Saturday or Sunday.
“At least one late” is awkward to add directly because it includes two paths (late then not late, not late then late) plus the path (late then late). The faster method is the complement.
Step 1: find the probability of no late buses
“No late buses” means not late on Saturday and not late on Sunday.
P(not late)=1−0.2=0.8 P(\text{not late})=1-0.2=0.8 P(not late)=1−0.2=0.8So:
P(no late)=0.8×0.8=0.64 P(\text{no late})=0.8\times 0.8=0.64 P(no late)=0.8×0.8=0.64Step 2: use the complement
P(at least one late)=1−0.64=0.36 P(\text{at least one late})=1-0.64=0.36 P(at least one late)=1−0.64=0.36This is a frequent pattern in GCSE probability tree diagrams, and it shows up in predicted and practice papers too. If you’re revising for Edexcel, AQA, OCR or Eduqas, it’s also worth doing mixed practice from the revision collections such as: GCSE revision Summer 2024 page.
Bringing tree diagrams into A Level thinking
Tree diagrams don’t stop at GCSE. At A Level, the same picture supports conditional probability and Bayes’ theorem logic, even when the question doesn’t explicitly say “draw a tree”.
For example, if a disease is present with probability 0.020.020.02, and test accuracy depends on whether the person has the disease, that is exactly a “probabilities change based on the first branch” situation. That’s the same structure as “without replacement”, just in a different story.
If you’re bridging into A Level Statistics, practising tree diagrams now makes conditional probability feel less like a new topic and more like a familiar method in a smarter suit. Maths Genie’s A Level Statistics resource pack includes this style: S1 Probability questions.
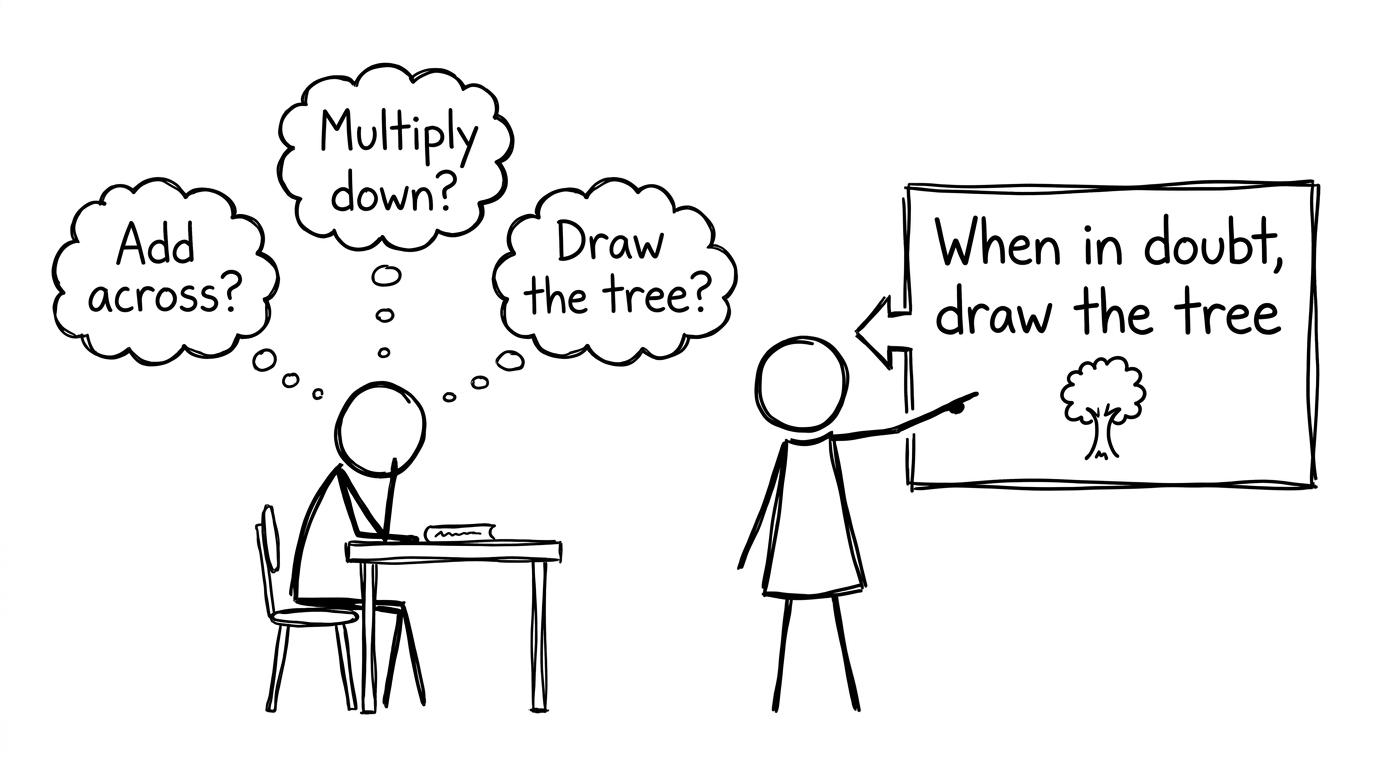 A student debating add across vs multiply down with a teacher sign
Common mistakes that cost GCSE marks
These are the errors that show up again and again in mark schemes and examiner reports. They’re rarely about “not understanding”; they’re about rushing.
- Branches from a node don’t add to 111. If P(win)=0.6P(\text{win})=0.6P(win)=0.6, then P(not win)P(\text{not win})P(not win) must be 0.40.40.4, not 0.60.60.6 again.
- Using replacement probabilities when there is no replacement. The second denominator must change from 888 to 777 in a two-pick question.
- Multiplying when you should add. “Win exactly one” is two separate paths, so you add them.
- Adding when you should multiply. “Win both” is one path, so you multiply along it.
- Mixing up “at least one” with “exactly one”. “At least one” includes two wins, “exactly one” does not.
- Not simplifying fractions or giving the required form. If the question says “give your answer as a fraction”, don’t leave 0.5357…0.5357\ldots0.5357….
To train yourself out of these mistakes, it helps to mark your work properly. Use Maths Genie resources that include answers and solutions, like: Tree Diagrams practice booklet.
Bringing it all together for GCSE exam success
When GCSE probability tree diagrams are explained well, they stop feeling like diagrams you draw for the sake of it and start feeling like a thinking tool. You’re not decorating the page; you’re making the question smaller, one branch at a time.
If you want to get reliably good at this topic, do it the Maths Genie way: learn the method, then practise until the structure becomes automatic. Start with the revision support on Probability revision, then work through focused booklets like Probability Trees exam questions and Tree Diagrams practice booklet. After that, mix it into timed revision using the GCSE revision Summer 2024 page so you can practise tree diagrams under exam conditions.
Your next step: open a Maths Genie set, do three questions, mark them, and rewrite any tree diagram where a node doesn’t add to 111. That single habit is where a lot of GCSE marks quietly come from.