GCSE Geography State vs Private Results Explained
GCSE geography state vs private results show a raw attainment gap, but not its cause. Learn what official figures reveal and how to read them carefully.
A results chart can look like a verdict. One bar is taller, another is shorter, and within seconds it seems to tell you which type of school is “better”. But the GCSE geography state vs private results comparison needs more care than that.
The short answer is that independent-school pupils generally achieve a higher proportion of top GCSE grades than pupils across state-funded schools, and geography tends to reflect that wider attainment pattern. However, the raw difference does not prove that paying fees causes higher geography grades. The groups differ in prior attainment, admissions, pupil characteristics, subject entry patterns and many other ways.
For students preparing for maths exams, this is also a useful lesson in statistics: a comparison may be numerically correct while the conclusion drawn from it is too strong.
The results checklist
Before interpreting any school-type comparison, ask:
- Which year and nation does the data cover?
- Is it geography-specific or based on all GCSE subjects?
- Does “state school” combine selective, comprehensive and academy settings?
- Are the figures percentages, pupil counts or average grades?
- Are we comparing grade 444 and above or grades 777 to 999?
- Were all pupils equally likely to enter GCSE Geography?
- Does the evidence show association, or can it establish causation?
These questions are not technical obstacles. They are what stop a simple chart becoming a misleading story.
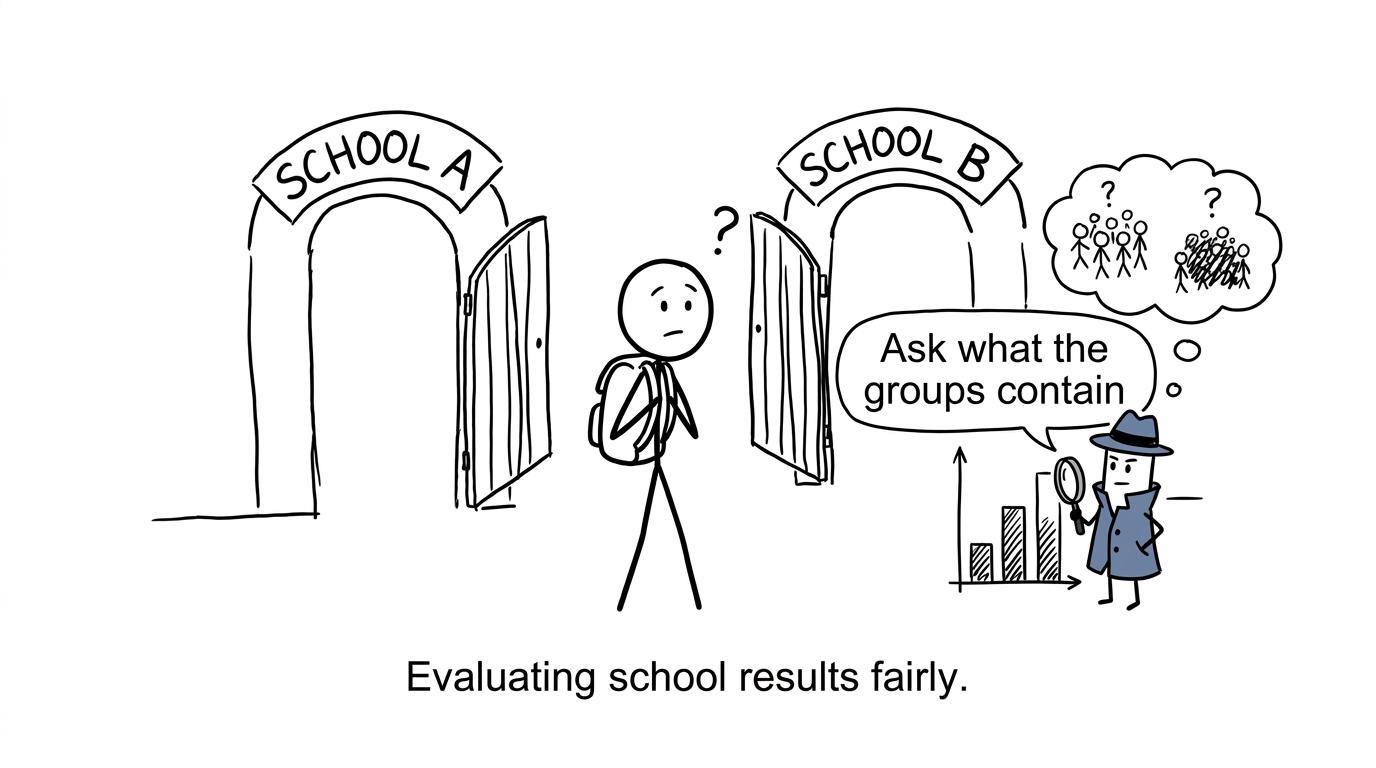 A student comparing two schools while a chart detective asks what each group contains
What the latest official GCSE data shows
At the time of writing, the latest completed GCSE results cycle is summer 202520252025. Official results information is published by organisations including Ofqual, the Department for Education and the Joint Council for Qualifications. Their releases show grade distributions by subject and provide several breakdowns by centre or school category.
Across GCSE subjects overall, independent schools record a substantially higher share of grades 777 to 999 than the broad state-funded sector. Geography-specific breakdowns available through official results tools point in the same general direction: independent-school candidates are more heavily represented among higher grades.
That is the defensible headline. It should not be stretched further than the data allows.
Official categories are not always a neat two-way split between “state” and “private”. State-funded education includes comprehensive schools, academies, free schools, grammar schools and other settings. Selective state schools can have outcomes very different from non-selective schools. Independent schools also vary considerably.
Consequently, one national percentage for each broad sector conceals the distribution within both groups. An average describes a group; it does not describe every school or determine an individual pupil’s result.
Why the exact gap can change
The size of the reported difference depends on the measure chosen. Common thresholds include:
- grade 444 or above, often described as a standard pass;
- grade 555 or above, commonly called a strong pass;
- grades 777 to 999, representing the highest grade range;
- the complete distribution from grade 999 to grade 111.
A sector could have a large gap at grades 777 to 999 but a smaller gap at grade 444 and above. Both statements could be true because they answer different questions.
The year matters too. Grade boundaries, the cohort entering the subject and national grading arrangements can change. Comparisons are most reliable when they use the same qualification, year, nation and grade threshold.
How to read the percentages correctly
Suppose an official release reports the proportion of geography entries reaching a chosen threshold. That proportion is defined by:
Percentage reaching threshold=entries reaching thresholdall relevant entries×100\text{Percentage reaching threshold}=\frac{\text{entries reaching threshold}}{\text{all relevant entries}}\times 100Percentage reaching threshold=all relevant entriesentries reaching threshold×100The denominator matters. GCSE result statistics normally concern examination entries, not necessarily every pupil attending that type of school. If geography is optional and different proportions of pupils choose it, the candidates being compared may not represent the full school populations in the same way.
A second distinction is between a percentage-point difference and percentage change. If two reported proportions are p1%p_1\%p1% and p2%p_2\%p2%, their percentage-point gap is:
∣p1−p2∣\left|p_1-p_2\right|∣p1−p2∣A relative percentage change uses a different calculation:
p2−p1p1×100%\frac{p_2-p_1}{p_1}\times 100\%p1p2−p1×100%Confusing these measures can make an attainment gap sound larger or smaller than it is. Students can strengthen these skills through MathsGenie’s GCSE statistics revision resources, alongside its lessons on averages and range and frequency tables.
What the comparison does not tell you
The figures do not isolate the effect of school type. They show an association between the recorded category and examination outcomes.
They do not prove that fees cause higher grades
Pupils do not enter schools through a random process. Independent schools may select academically, financially or through admissions procedures, while grammar schools select through attainment tests. Families also differ in income, prior educational opportunities and access to support.
To claim that school type itself caused the entire results gap, researchers would need to account carefully for these differences. A simple results table cannot do that.
They do not compare identical starting points
Prior attainment is strongly relevant to later examination performance. If one group begins secondary education with a different attainment profile, comparing final grades alone does not measure the progress made by its schools.
Measures of progress can add useful context, but even adjusted measures require careful interpretation. They depend on the pupils included, the methodology used and the subjects counted.
They do not reveal the experience of every pupil
National data cannot tell you whether an individual department explains ideas clearly, gives useful feedback or supports fieldwork well. Nor does it reveal how much revision a particular student completed.
There will be state schools with excellent geography outcomes and independent schools with weaker ones. Group-level patterns allow us to describe groups, not predict every member.
They do not create a level playing field automatically
Resources, staffing, class sizes, timetable allocation and access to fieldwork may differ between schools. Yet public grade tables alone cannot show which factor mattered, by how much, or whether it had the same effect everywhere.
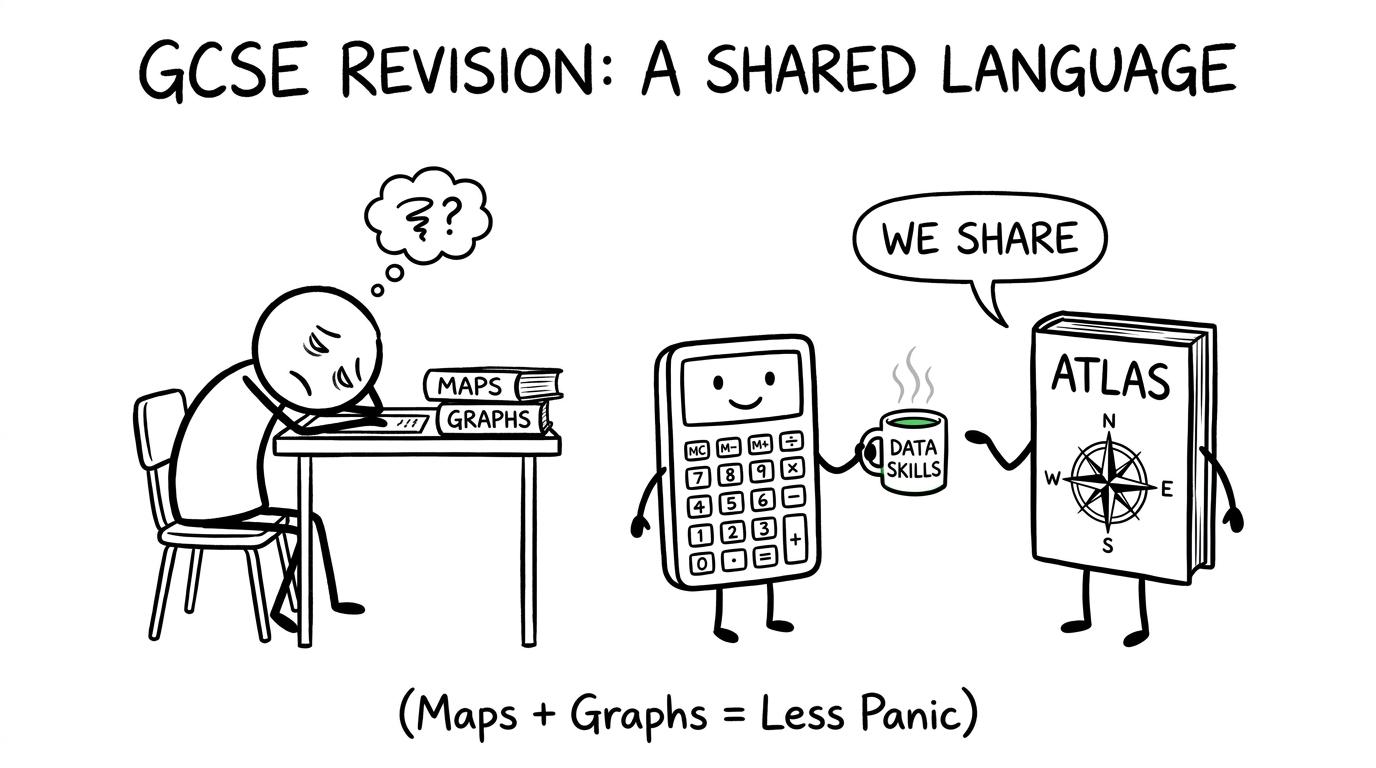 A student, calculator and atlas discovering that geography and maths share data skills
Why GCSE Geography results matter to maths students
Geography and maths meet more often than their classroom timetables suggest. Geography examinations can involve maps, scale, percentages, ratios, averages, graphs and unfamiliar data sets. Maths exams test many of the same habits: reading labels, identifying the denominator and resisting conclusions unsupported by evidence.
AQA, Edexcel, OCR and Eduqas have their own GCSE Geography specifications and assessment structures, so students should follow the requirements for their examination board. Across those specifications, however, interpreting quantitative information is an important geographical skill.
For maths revision, comparisons between school outcomes reinforce several transferable ideas:
- the mean can hide variation;
- unequal group sizes affect frequency comparisons;
- correlation does not establish causation;
- a graph’s scale can influence its visual impact;
- a sample or entry group may not represent a whole population;
- context determines whether a calculation answers the question asked.
MathsGenie’s lessons on cumulative frequency, box plots and histograms help develop precisely this kind of disciplined data reading.
A better way to compare school outcomes
A more informative investigation would place several measures side by side rather than looking for one winning statistic.
First, compare the complete grade distribution. A single threshold discards information about grades above and below it.
Next, separate meaningful school categories where the data permits. A selective grammar school and a non-selective comprehensive should not automatically be treated as interchangeable merely because both are state-funded.
Then consider entries. Ask what proportion of the cohort took geography and whether schools followed the same GCSE qualification. Entry decisions can alter the composition of the examined group.
Finally, examine prior attainment and pupil characteristics. This does not mean explaining away every difference. It means recognising that an outcome has several possible influences.
The best conclusion may sound less dramatic: independent-school geography candidates tend to achieve higher raw grade outcomes, but school type alone does not explain the gap. Less dramatic often means more accurate.
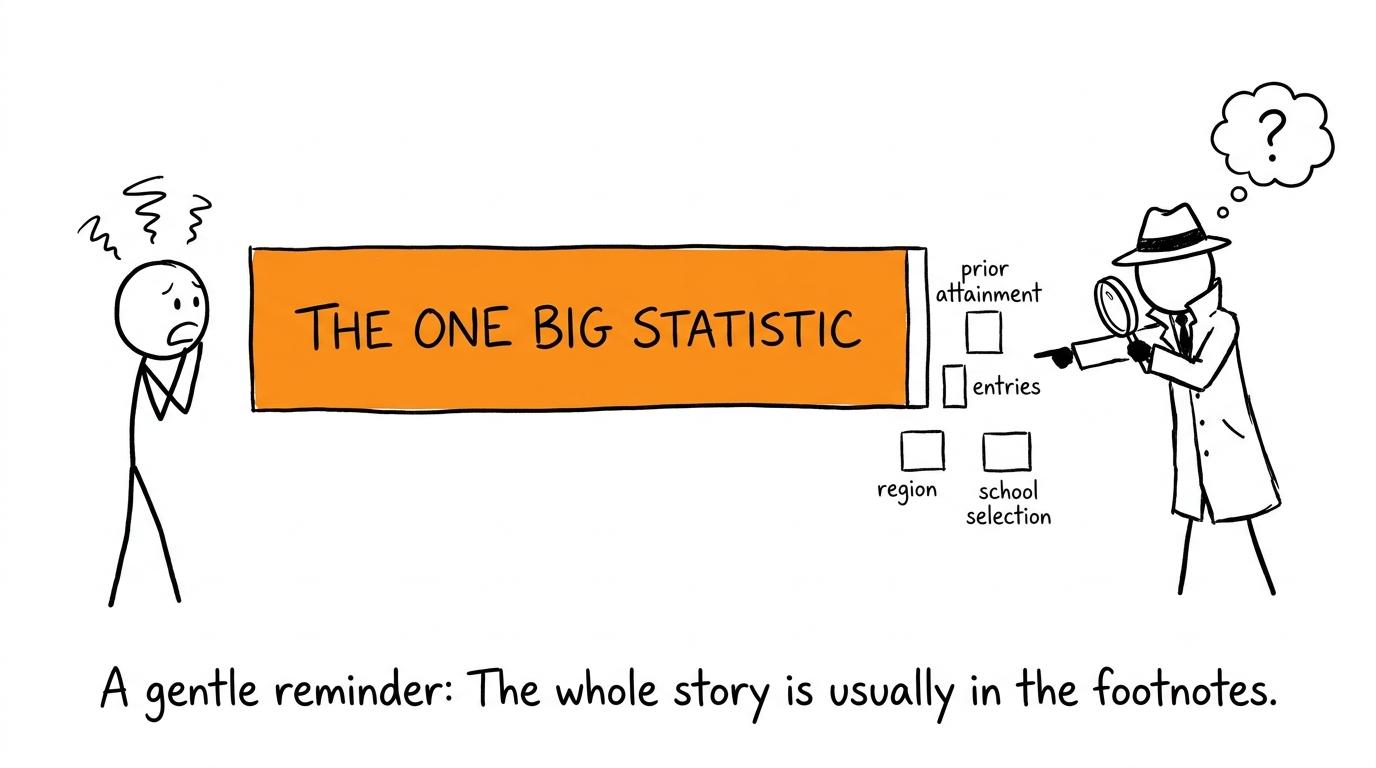 A chart detective notices the smaller factors hidden beside one enormous headline bar
Common mistakes when interpreting state and private results
Treating all state schools as one kind of school
The state sector contains schools with different admissions policies, pupil populations and local contexts. Combining them is sometimes necessary for a national summary, but it removes detail.
Comparing figures from different years
A 202520252025 independent-school percentage should not be compared casually with a 202420242024 state-school percentage. Cohorts and grading conditions may differ.
Mixing subjects or qualifications
An all-subject GCSE statistic is not automatically a GCSE Geography statistic. International GCSE entries may also appear separately from regulated GCSE results in some publications.
Ignoring the denominator
A percentage based on entries answers a different question from one based on the entire pupil cohort. Always identify who is included.
Assuming correlation means causation
A higher result for one group does not, by itself, identify the mechanism producing it. Selection, prior attainment and background factors may all contribute.
Letting sector averages define your expectations
A national pattern is not a ceiling on your own grade. Your next practice question, correction and revision session are more actionable than the label attached to your school.
Turn the comparison into useful revision
The healthiest response to school-result data is neither denial nor fatalism. It is curiosity followed by action.
Use comparisons to practise reading percentages, checking scales and evaluating claims. Then return to the work you can control. MathsGenie’s free GCSE maths revision lessons organise topics by grade and include videos, practice questions and answers. Once your topic knowledge is secure, use GCSE maths past papers to practise full examination technique and predicted papers for additional exam-style questions.
The GCSE geography state vs private results comparison reveals a genuine raw attainment difference. It does not reveal a single cause, rank every school fairly or decide what any student can achieve. Statistics become valuable when they sharpen judgement rather than replace it.
Start with one weak maths topic today. Watch the revision lesson, complete the practice questions, mark them honestly and revisit each error. School-level data describes the past performance of groups. Your revision plan still shapes what happens next.