GCSE English Literature Gender Gap Results
GCSE English Literature gender gap results reveal a clear 2025 difference. Explore the national figures, interpret them and improve your maths revision.
If you are searching for GCSE English Literature gender gap results, the short answer is yes: the latest national results show a clear difference between female and male candidates. In England's 2025 GCSE English Literature results, female candidates were more likely to achieve grades 777-999, grade 444 or above, and grade 999.
But national data is context, not destiny. It describes outcomes across hundreds of thousands of entries; it does not predict what any individual student will achieve. For a GCSE maths student, this is also a useful lesson in statistical interpretation: ask what was measured, compare the right percentages and resist turning correlation into explanation.
The results at a glance
The key points are:
- Female candidates achieved higher English Literature results at the main grade thresholds in 2025.
- At grades 777-999, the difference was approximately 9.99.99.9 percentage points.
- At grade 444 or above, the difference was approximately 10.810.810.8 percentage points.
- The English Literature gap was wider than the overall GCSE gender gap across all subjects.
- Entry numbers were broadly balanced between male and female candidates.
- The figures reveal an association between sex and outcomes, but they do not establish its causes.
The data comes from the Joint Council for Qualifications' 2025 full-course GCSE results for England. JCQ combines results supplied by awarding organisations, giving a national picture rather than the experience of one school or exam board.
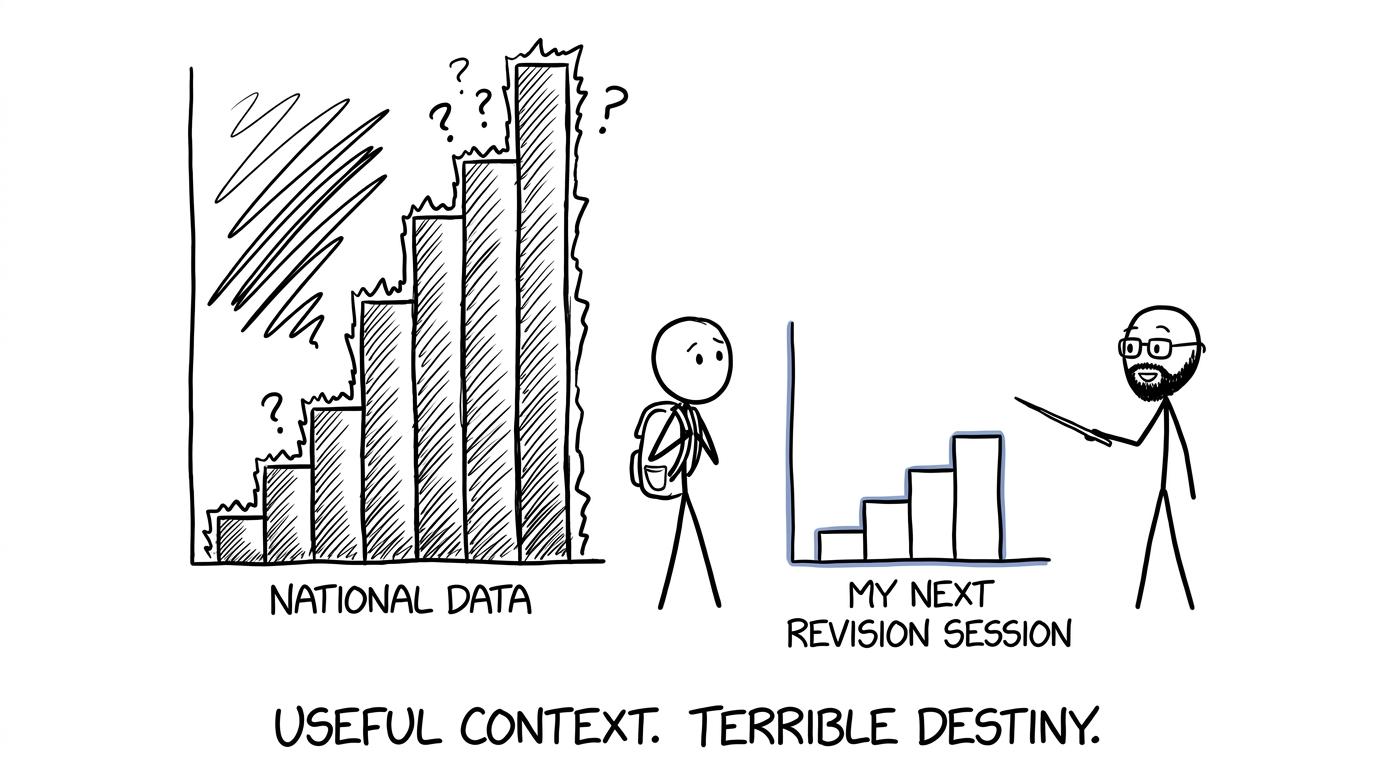 A student choosing a manageable revision staircase rather than being intimidated by national data
What the 2025 national data shows
The 2025 English Literature table recorded 306,761306{,}761306,761 male entries and 301,349301{,}349301,349 female entries in England. That makes the entry population broadly balanced, which matters: the outcome difference cannot simply be dismissed as the result of one group supplying nearly all the entries.
| Grade threshold | Male candidates | Female candidates | Difference |
|---|---|---|---|
| Grade 999 | 2.3%2.3\%2.3% | 4.9%4.9\%4.9% | 2.62.62.6 percentage points |
| Grades 777-999 | 15.3%15.3\%15.3% | 25.1%25.1\%25.1% | 9.99.99.9 percentage points |
| Grade 555 or above | 51.3%51.3\%51.3% | 64.6%64.6\%64.6% | 13.313.313.3 percentage points |
| Grade 444 or above | 68.6%68.6\%68.6% | 79.4%79.4\%79.4% | 10.810.810.8 percentage points |
Figures are rounded to one decimal place, so differences calculated from the displayed values may vary slightly from calculations using the unrounded data.
The gap is visible throughout the grade distribution, not only at the very top. Roughly one quarter of female entries achieved grades 777-999, compared with just over one seventh of male entries. At the standard pass threshold of grade 444, almost four fifths of female entries reached the threshold, compared with a little over two thirds of male entries.
How this compares with GCSE results overall
Across all GCSE subjects taken by 161616-year-olds in England in 2025, official analysis reported that 25.5%25.5\%25.5% of female entries and 20.5%20.5\%20.5% of male entries achieved grade 777 or above. At grade 444 or above, the corresponding figures were 73.6%73.6\%73.6% and 67.5%67.5\%67.5%.
Those overall differences were 5.05.05.0 and 6.16.16.1 percentage points respectively. English Literature therefore had a larger gender difference at both thresholds. However, Ofqual also reported that the overall GCSE attainment gap narrowed in 2025 because male outcomes improved slightly while female outcomes changed little or fell marginally, depending on the threshold.
That broader trend should not be confused with the subject-specific English Literature figures. Averages across all subjects can hide substantial variation between subjects.
How to interpret the gender gap accurately
A percentage-point gap compares two proportions directly. If pfp_fpf is the percentage for female candidates and pmp_mpm is the percentage for male candidates, the gap is:
gap=pf−pm\text{gap}=p_f-p_mgap=pf−pmThis is not the same as percentage change. Saying there was a 9.99.99.9 percentage-point gap at grades 777-999 is clearer than saying female candidates performed “9.9%9.9\%9.9% better”, which would describe a different calculation.
There is another important distinction: these are percentages of entries, not evidence that every girl outperformed every boy. The distributions overlap. Many male candidates received high grades, and many female candidates did not reach a particular threshold. Group averages say nothing certain about an individual.
GCSE grades are also awarded using subject-level standards. There is no separate grade boundary for male and female candidates. Students taking AQA, Edexcel, OCR or Eduqas specifications are assessed according to their relevant paper and mark scheme, not against a gender target.
What the figures cannot tell us
National results describe what happened. They do not, by themselves, explain why it happened.
Possible explanations discussed in education research can include differences in prior attainment, reading experience, attendance, confidence, classroom engagement, revision behaviour and wider social expectations. Disadvantage, special educational needs, school context and access to support may also interact with gender. These influences are difficult to separate in a simple results table.
It would therefore be unsafe to look at the association and conclude that gender directly causes the difference. A stronger analysis would need pupil-level data, controls for relevant characteristics and evidence collected over time. Even then, conclusions should be expressed carefully.
The pandemic years require particular caution too. Research using National Pupil Database records found that gender gaps in top GCSE grades widened in several subjects during teacher-assessed grading, with English Literature among the subjects where the largest gap appeared in 2020. Those exceptional assessment arrangements are not directly comparable with the normal examined series used in 2025.
Why this matters to GCSE maths students
At first glance, English Literature results may seem distant from foundation or higher tier maths. Yet the way you read this data uses familiar GCSE statistics skills:
- identifying the population represented by a table;
- distinguishing frequency from proportion;
- comparing percentages rather than raw totals;
- recognising the effect of rounding;
- separating percentage points from percentage change;
- understanding that correlation does not prove causation;
- questioning whether an average hides variation.
These habits matter in questions involving frequency tables, charts, sampling and misleading statistics. They remain valuable at A Level, where statistical claims require even more attention to assumptions and evidence.
You can strengthen these skills through the free GCSE maths revision hub, which brings together revision lessons, exam questions, worksheets, papers and solutions. The purpose is not merely to remember definitions. It is to become harder to mislead with a graph, percentage or headline.
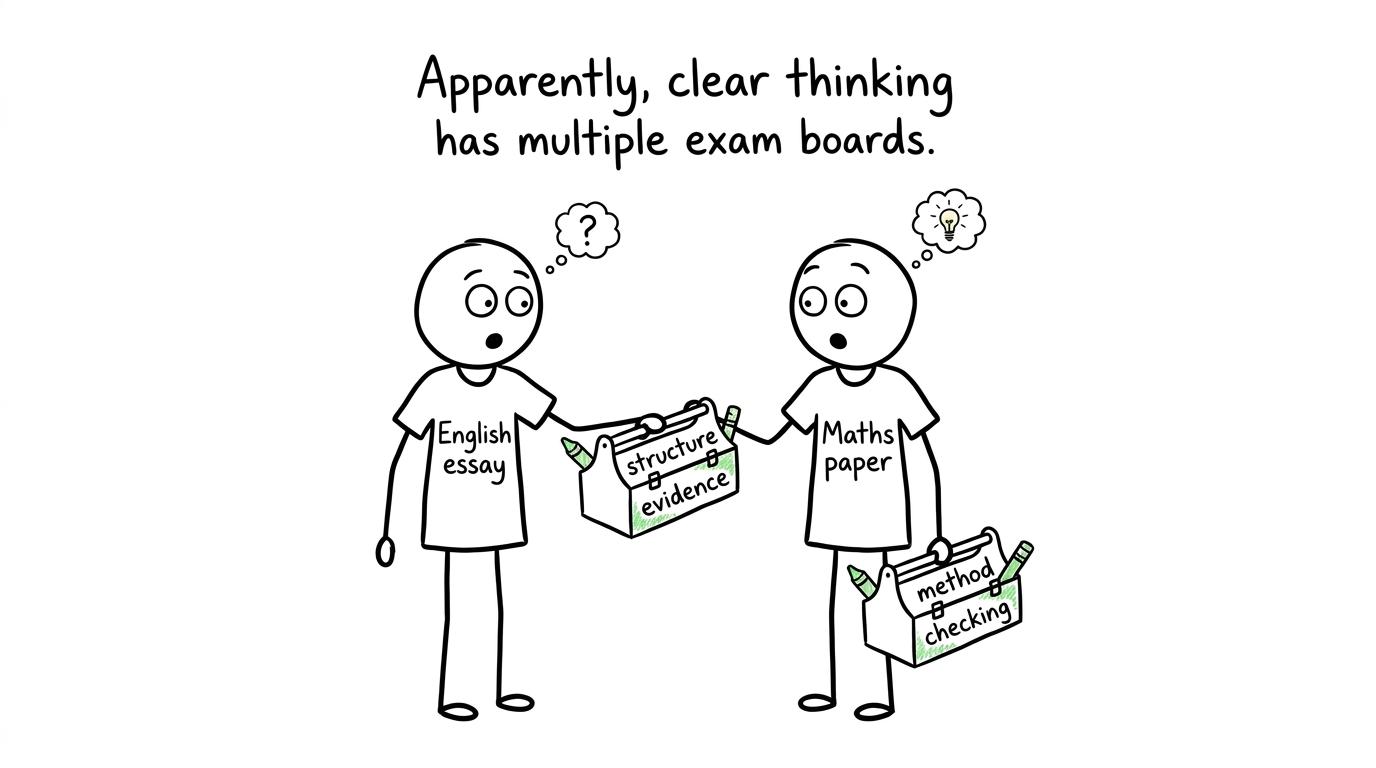 English and maths students discovering that structure, evidence, method and checking are shared tools
What students should take from the data
The most useful response is not to treat a national pattern as a personal forecast. It is to focus on the actions that can change your own result.
A strong maths revision cycle is simple:
- diagnose a weak area with a mini test or paper;
- revisit the relevant method;
- complete focused practice questions;
- mark the work carefully;
- record the precise reason for each lost mark;
- retest the topic later without notes.
The GCSE maths revision timetable explains how to make this cycle part of a realistic week. If exams are closer, use the one-month GCSE maths revision plan or the more focused one-week revision plan.
Paper practice should develop gradually. The guide to when to start GCSE past papers shows how to move from short diagnostic work to timed papers. You can also review GCSE maths topics that frequently appear, while allowing your own marked work to decide the final priorities.
National averages are beyond your control. Your next corrected mistake is not.
Common mistakes when discussing these results
Treating percentage points as percentages
A movement from 15%15\%15% to 25%25\%25% is an increase of 101010 percentage points, not 10%10\%10%. Mixing these terms can make a difference look smaller or larger than it is.
Confusing entries with individual pupils
Results tables generally count qualification entries. They do not automatically tell you how many unique pupils were entered across several subjects, nor do they describe every member of a demographic group.
Assuming that a gap proves a cause
The results show an association. They cannot prove that gender itself caused the outcome or identify a single explanation.
Mixing English Language and English Literature
They are separate GCSE qualifications with different assessments and result distributions. A figure reported for “English” may combine or select qualifications differently, so always inspect the label and methodology.
Turning a group result into a personal expectation
A national average is not a ceiling, a grade prediction or a reason to lower expectations. Your preparation, understanding and exam decisions still matter.
Reading the headline but ignoring the denominator
Percentages need context. Check the number of entries, the country covered, the age group, the exam series and whether the data refers to one subject or all GCSEs.
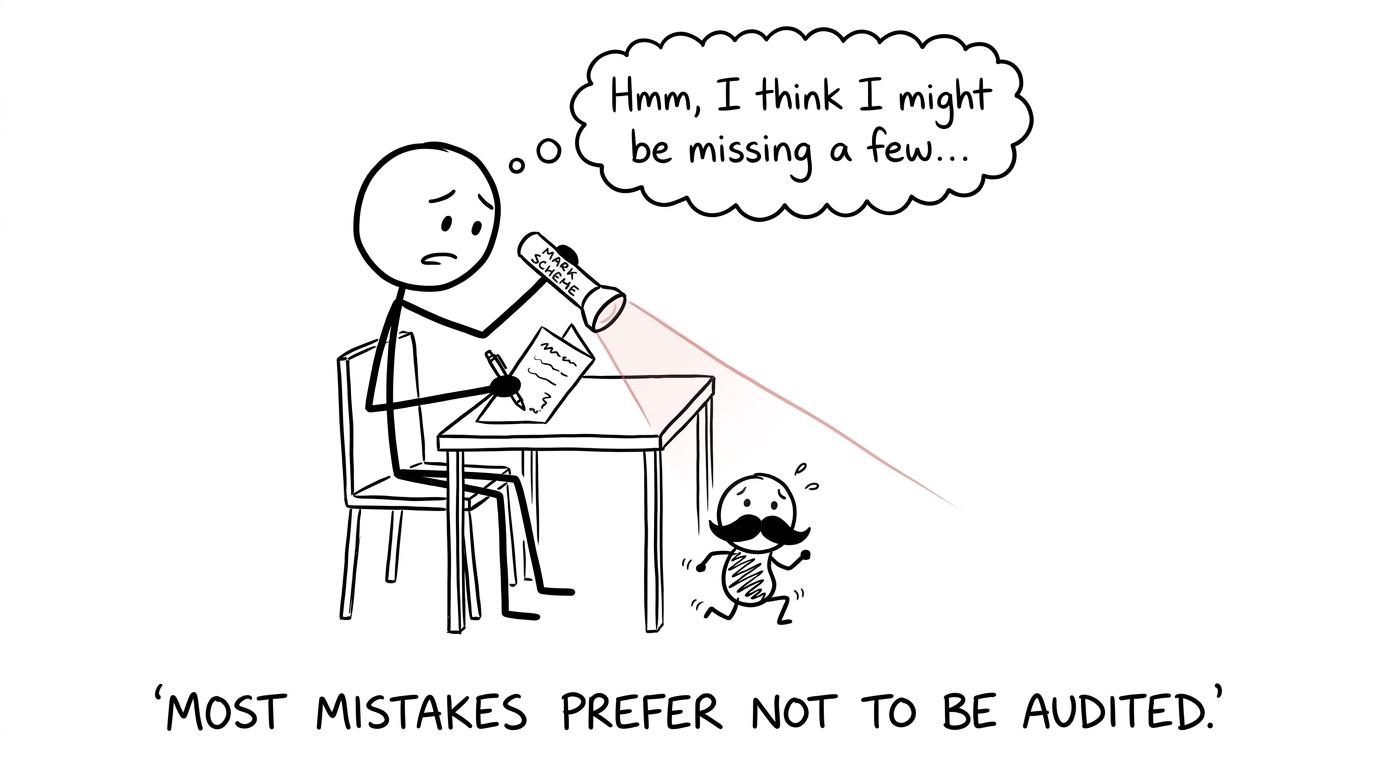 A student using a mark scheme to stop a disguised mistake escaping
The result that matters next
The 2025 evidence is clear: female candidates achieved higher GCSE English Literature outcomes than male candidates at the principal grade thresholds in England. The gap was substantial, particularly at grade 444 or above and grades 777-999. What the figures do not provide is a simple cause or a verdict on any individual student.
That is the quiet power of statistics. Good data can show a pattern while still leaving room for caution, curiosity and change.
For your own maths result, begin with the MathsGenie GCSE maths resources. Use free revision lessons to rebuild understanding, practice questions and mini tests to expose weak areas, then past papers, predicted papers, mark schemes and video solutions to turn errors into marks. If the exam is very close, follow the GCSE maths night-before plan rather than trying to revise everything at once.