

GCSE English Language Gender Gap Results Explained
GCSE English Language gender gap results explained through national data, careful context, data-reading tips and practical revision advice for students.
A national result can feel strangely personal. You see a headline saying one group performs better than another, then wonder what it predicts about your own exam. Usually, far less than it appears to.
The GCSE English Language gender gap results show a persistent national pattern: in recent official datasets, female candidates have achieved higher cumulative percentages than male candidates at important grade thresholds, including grade 4 or above and grade 7 or above. The gap is real at cohort level, but it does not determine any individual student’s grade or prove that gender itself causes the difference.
That distinction matters. Data can describe what happened across hundreds of thousands of entries. It cannot read your next answer, measure the quality of your revision or decide how you will perform in maths.
The findings at a glance
The latest available national evidence can be summarised carefully:
- Recent Joint Council for Qualifications full-course results show female candidates ahead of male candidates in GCSE English Language at key cumulative grade thresholds.
- Department for Education attainment statistics for England also show broader differences between male and female pupils in English-related measures.
- The size of the gap changes according to the year, population and grade threshold being examined.
- Official tables generally classify pupils by recorded sex using male and female categories. Calling this a gender gap is common, but it is important to understand what the data actually records.
- A difference in outcomes does not identify a single cause and cannot predict an individual result.
- English Language is not divided into foundation and higher tiers, unlike GCSE maths.
The wisest interpretation is neither to dismiss the pattern nor exaggerate it. It is to ask what the figures measure, what they leave out and what students can control.
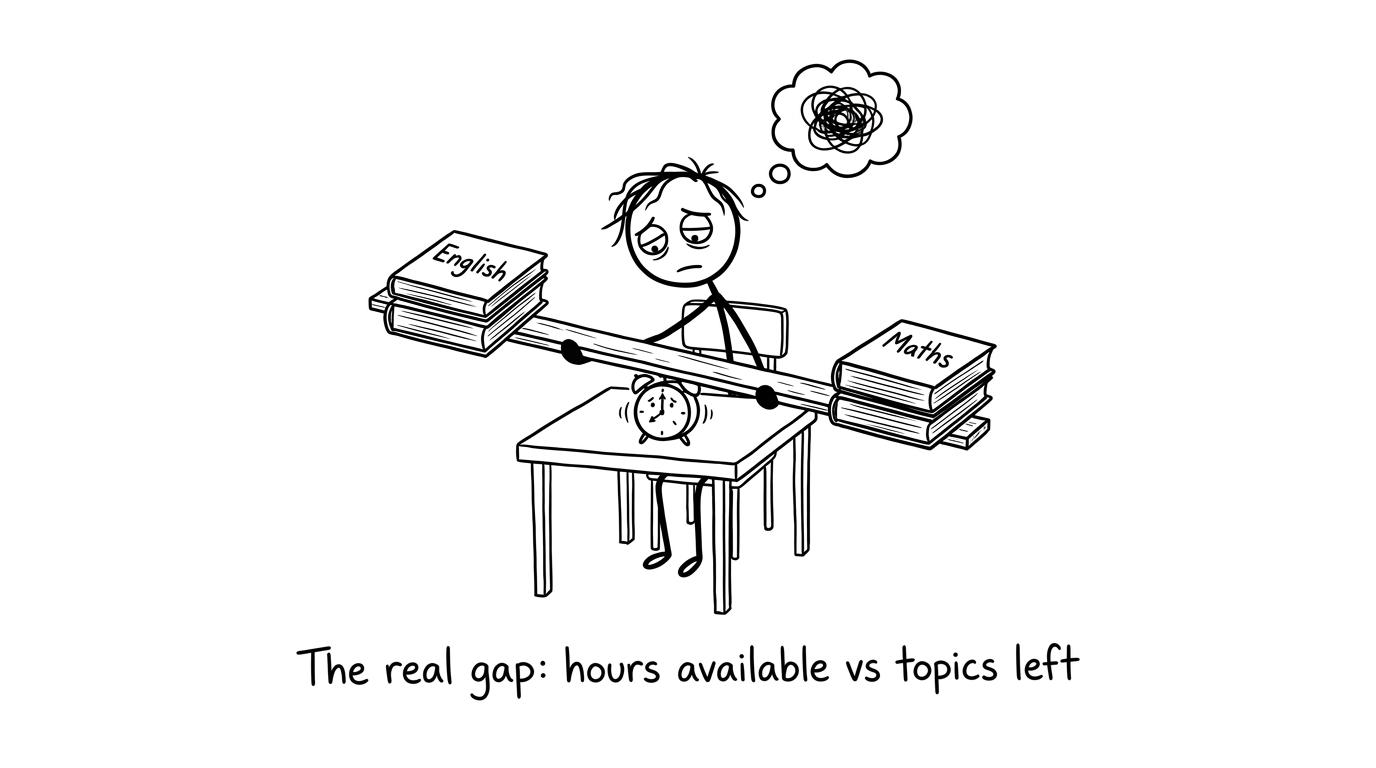 A student balancing English and maths revision on a seesaw
What national GCSE English Language data shows
The main UK-wide source for annual GCSE outcomes is the Joint Council for Qualifications, commonly called JCQ. Its full-course tables report cumulative grade percentages by subject and by male or female classification. In the 2025 results, the published table again showed a higher proportion of female candidates reaching key English Language grade thresholds than male candidates.
For England, the Department for Education publishes Key Stage 4 attainment data. These statistics can examine pupils and schools in more detail, although some headline measures combine English and maths or use an English measure rather than English Language alone. Ofqual also publishes equalities analyses intended to explore whether differences remain after accounting for certain available characteristics.
These sources answer related but different questions. JCQ data covers GCSE results across the UK awarding organisations represented by JCQ. Department for Education data focuses on England and applies its own cohort and school-inclusion rules. Ofqual’s analysis uses statistical modelling rather than simply comparing two percentages.
That is why two apparently authoritative figures may differ without either being wrong. They may use different:
- geographical populations;
- years or exam series;
- candidate inclusion rules;
- grade thresholds;
- subjects or combined attainment measures;
- statistical methods.
For students accustomed to checking a maths answer, this is the statistical equivalent of reading the question before calculating.
How to measure the results gap correctly
A common way to describe the difference is with a percentage-point gap. If pfp_fpf is the percentage of female candidates meeting a threshold and pmp_mpm is the corresponding percentage of male candidates, then:
percentage-point gap=pf−pm\text{percentage-point gap}=p_f-p_mpercentage-point gap=pf−pmThis is not necessarily the same as a percentage increase. A percentage-point comparison subtracts two rates directly; a relative percentage comparison divides the difference by a reference rate:
relative difference=pf−pmpm×100%\text{relative difference}=\frac{p_f-p_m}{p_m}\times 100\%relative difference=pmpf−pm×100%The two measures answer different questions, so an article that uses the word “percent” loosely can make a modest difference look larger than it is.
There is another issue: cumulative thresholds. “Grade 7 or above” includes grades 7, 8 and 9. It should not be interpreted as the proportion receiving grade 7 alone. Likewise, grade 4 or above includes every grade from 4 to 9.
These habits are useful beyond English. GCSE maths questions involving percentages, frequency diagrams and grouped data reward the same precision. MathsGenie’s free GCSE maths revision lessons let you revisit the underlying skills, while the grade 4 revision topics, grade 5 revision topics and grade 7 revision topics help you target work at an appropriate level.
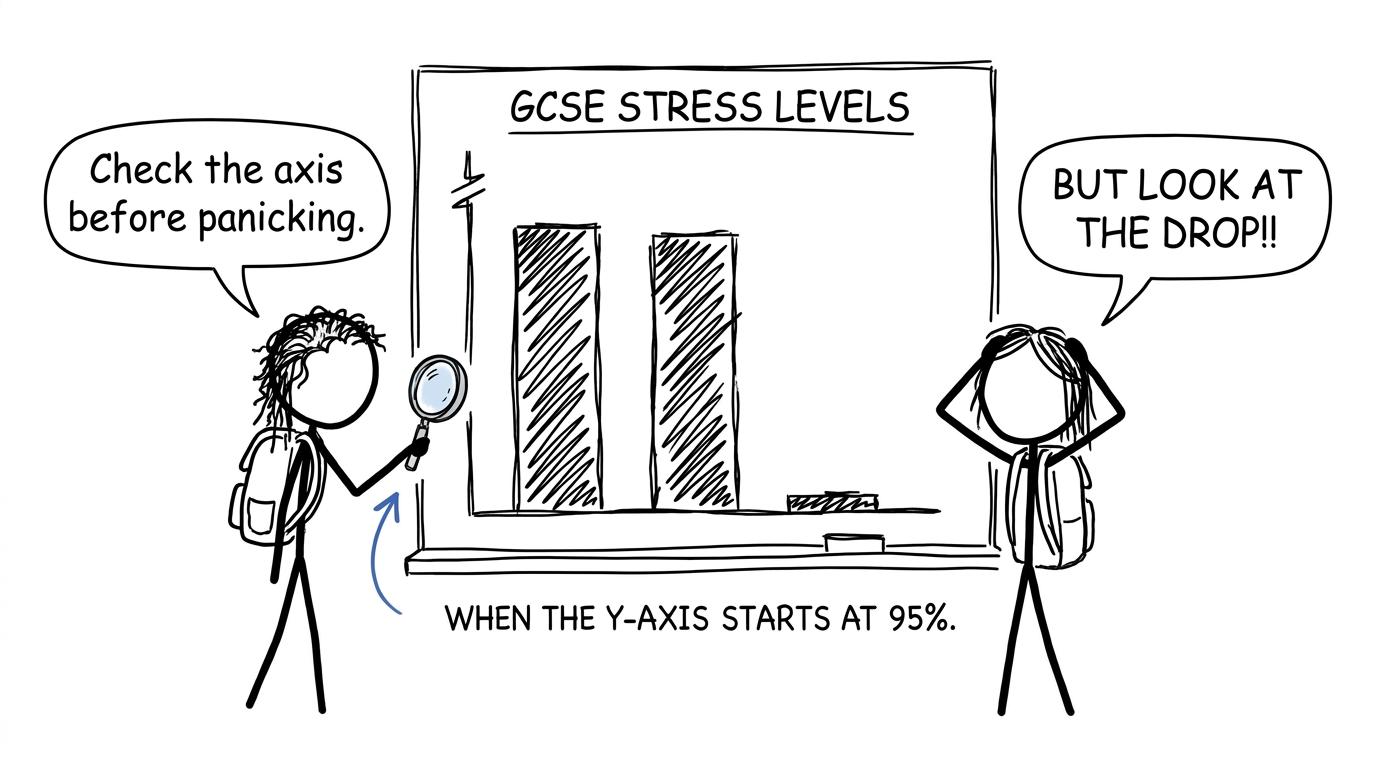 Students noticing a misleading chart axis
What the data does not prove
National results establish an association between recorded sex and attainment. They do not, by themselves, establish causation.
A simple comparison does not isolate differences in prior attainment, reading frequency, attendance, special educational needs, economic circumstances, classroom experience, confidence, subject engagement or assessment preparation. These factors can overlap, and the information available in a national dataset is never a complete description of a pupil’s life.
Even adjusted statistical analysis has limits. A model can account for variables that were measured and included; it cannot automatically control for every relevant influence. Its result is still an estimate about groups.
This is an example of a wider statistical principle:
association≠causation\text{association}\neq\text{causation}association=causationNor should averages be treated as identities. There are female candidates at every grade and male candidates at every grade. Variation within each group is substantial. Knowing the average outcome for a category does not tell you where a particular student sits within that distribution.
Why English Language and maths should be compared carefully
Students preparing for maths may naturally compare gaps across subjects, but the assessments are structured differently.
GCSE maths is offered at foundation and higher tier by Edexcel, AQA, OCR and Eduqas. Tier entry affects the range of grades available and the questions a candidate encounters. GCSE English Language is untiered, so all candidates following a particular specification sit papers designed for the full grade range.
The subjects also assess different combinations of knowledge and performance. English Language commonly involves reading unseen texts, analysing writers’ methods and producing extended writing. Maths assesses mathematical reasoning, fluency and problem-solving across specified content. A gap of a given size in one subject is therefore not automatically comparable with the same numerical gap in another.
Exam-board totals also require care. Specifications and paper structures vary, but awarding organisations use established processes to maintain grade standards. Raw marks from different papers should not be compared as if they came from one identical test.
For your own maths preparation, use materials matched to your board and tier. MathsGenie provides GCSE maths past papers alongside mark schemes and video solutions, making it easier to identify whether lost marks come from missing knowledge, an incomplete method or a misread question.
What these results mean for an individual student
The practical message is simple: a cohort pattern is context, not destiny.
Your result will come from the marks awarded for what appears in your script. National averages cannot earn those marks, but they cannot take them away either. The productive question is not, “What does my group usually achieve?” It is, “Which action is most likely to improve my next response?”
For maths, that means turning broad intentions into visible evidence:
- identify a precise weak topic;
- review the relevant method;
- answer practice questions without notes;
- mark the work honestly;
- record the reason for each lost mark;
- retry the question after a delay;
- complete timed papers as the exam approaches.
The process is deliberately ordinary. Improvement tends to arrive through repeated corrections rather than one dramatic revision session. MathsGenie’s predicted GCSE maths papers can support timed preparation, but they should complement full topic coverage and genuine past-paper practice rather than replace them.
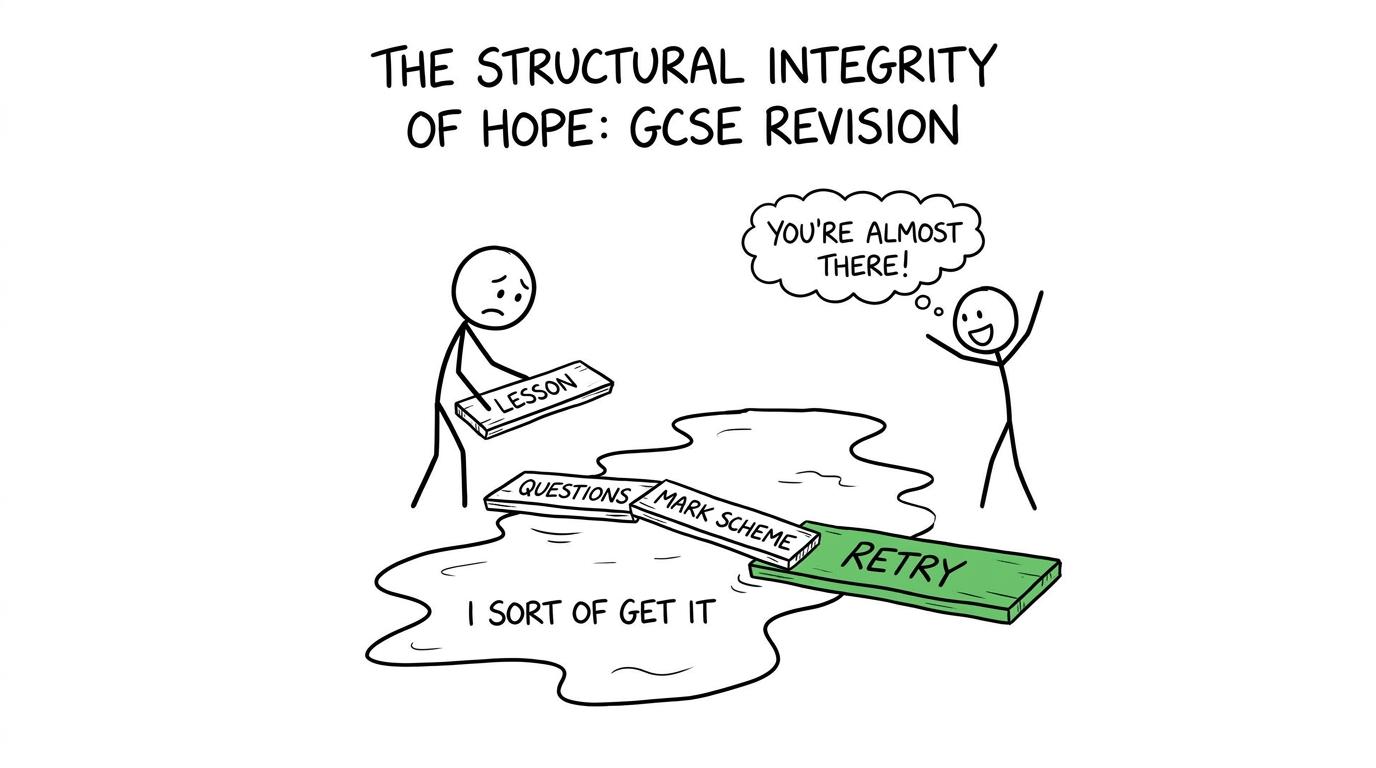 A student building a bridge from lessons, questions and retries
Common mistakes when interpreting the gender gap
Treating a group average as a personal forecast
National percentages describe a cohort. They do not set a ceiling or floor for any student. Personal preparation, prior knowledge and exam performance remain decisive.
Confusing percentage points with percentages
If two attainment rates are subtracted, the result is a percentage-point difference. Calling it a percentage increase without calculating a relative change is inaccurate.
Mixing incompatible datasets
A UK-wide JCQ table should not be placed beside an England-only school statistic without explaining the difference in coverage. Check the population, year and measure first.
Assuming the data explains the cause
The result tables show outcomes. They do not prove that one isolated biological, social or educational factor produced the pattern.
Comparing raw numbers rather than rates
If the male and female entry totals differ, candidate counts alone can mislead. Compare proportions calculated from the relevant group totals.
Forgetting that English Language is untiered
Foundation and higher tier are features of GCSE maths, not GCSE English Language. Importing tier explanations into English results creates a false comparison.
Letting statistics distract from revision
Interesting national data can become another form of procrastination. Once you understand the finding, return to what changes marks: lessons, retrieval, questions, feedback and correction.
From national patterns to your next paper
The GCSE English Language results reveal a consistent national difference between male and female candidate groups. They also reveal the limits of averages. The data can tell us about distributions and thresholds; it cannot tell us what you will write, which algebraic step you will notice or whether you will check the scale on a graph.
That uncertainty is good news. It leaves room for action.
Start with the free MathsGenie GCSE revision hub, choose one topic and complete its practice questions and mini test where available. Then move towards GCSE past papers with mark schemes and video solutions. Use predicted papers for focused exam preparation once your core knowledge is secure.
National statistics describe the road already travelled by a large cohort. Your revision plan is about the road still open to you.










